The Crash Report
Every fatal crash in America, charted.
Data from NHTSA FARS 2014–2023 bulk CSV. Covers ALL occupant fatalities in vehicles involved in fatal crashes, all model years on the road. Estimated rates use sales-based fleet estimates × NHTS class-average annual miles—see Methodology for caveats.
| ☐ | # ▲▼ | Vehicle ▲▼ | Class ▲▼ | 5yr Deaths ▲▼ | Annual Avg ▲▼ | Est. Fleet ▲▼ | Est. Rate ▲▼ |
|---|
Impairment defined as BAC > 0 (alcohol) or specific drug detected in toxicology (drugs). Testing rates vary significantly by state and jurisdiction — actual impairment rates may be higher than reported. Models with 100+ drivers in fatal crashes shown.
| ☐ | # ▲▼ | Vehicle ▲▼ | Class ▲▼ | Drivers ▲▼ | Any % ▲▼ | Any # ▲▼ | Alc % ▲▼ | Alc # ▲▼ | Drug % ▲▼ | Drug # ▲▼ |
|---|
Shows total occupant deaths by vehicle model year across FARS 2014–2023 data. Older model years have more cumulative years of exposure on the road; this chart reflects fleet-age composition, not inherent vehicle safety differences. Select up to 5 vehicles to compare.
2024 data is an early NHTSA estimate subject to revision. Bars show total fatalities (left axis); line shows rate per 100M VMT (right axis).
Rates calculated from NHTSA FARS fatality counts and FHWA VM-1 vehicle miles traveled. Per-model VMT is not publicly available; these rates apply at the broad vehicle-class level only.

86% of Distracted Driving Deaths Have Nothing to Do With a Phone
NHTSA’s 2024 data says cellphones were cited in only 14% of distraction-affected fatal crashes. The other 2,759 deaths? Daydreaming, eating, and distractions no law can touch.

Volvo Has a Moose Dummy. America Has 2 Million Deer Crashes and No Test at All.
Volvo crash-tests with a 794-pound moose dummy. Ford confirmed it doesn't test for animal impacts. GM declined to comment. NHTSA has no safety standard. Two million collisions a year, zero federal tests.

72 People a Year Die Dodging Mattresses on the Highway
AAA data shows nearly half of road debris deaths come from swerving, not impact. Your car can survive a mattress. It cannot survive the median barrier you hit dodging one.

Zoox Recalled Every Car It Has. All 105 of Them.
Amazon’s self-driving unit recalled its entire fleet after one robotaxi drove into a fire scene it couldn’t see. NHTSA had just told the whole industry to fix this. Zoox was the first to respond.

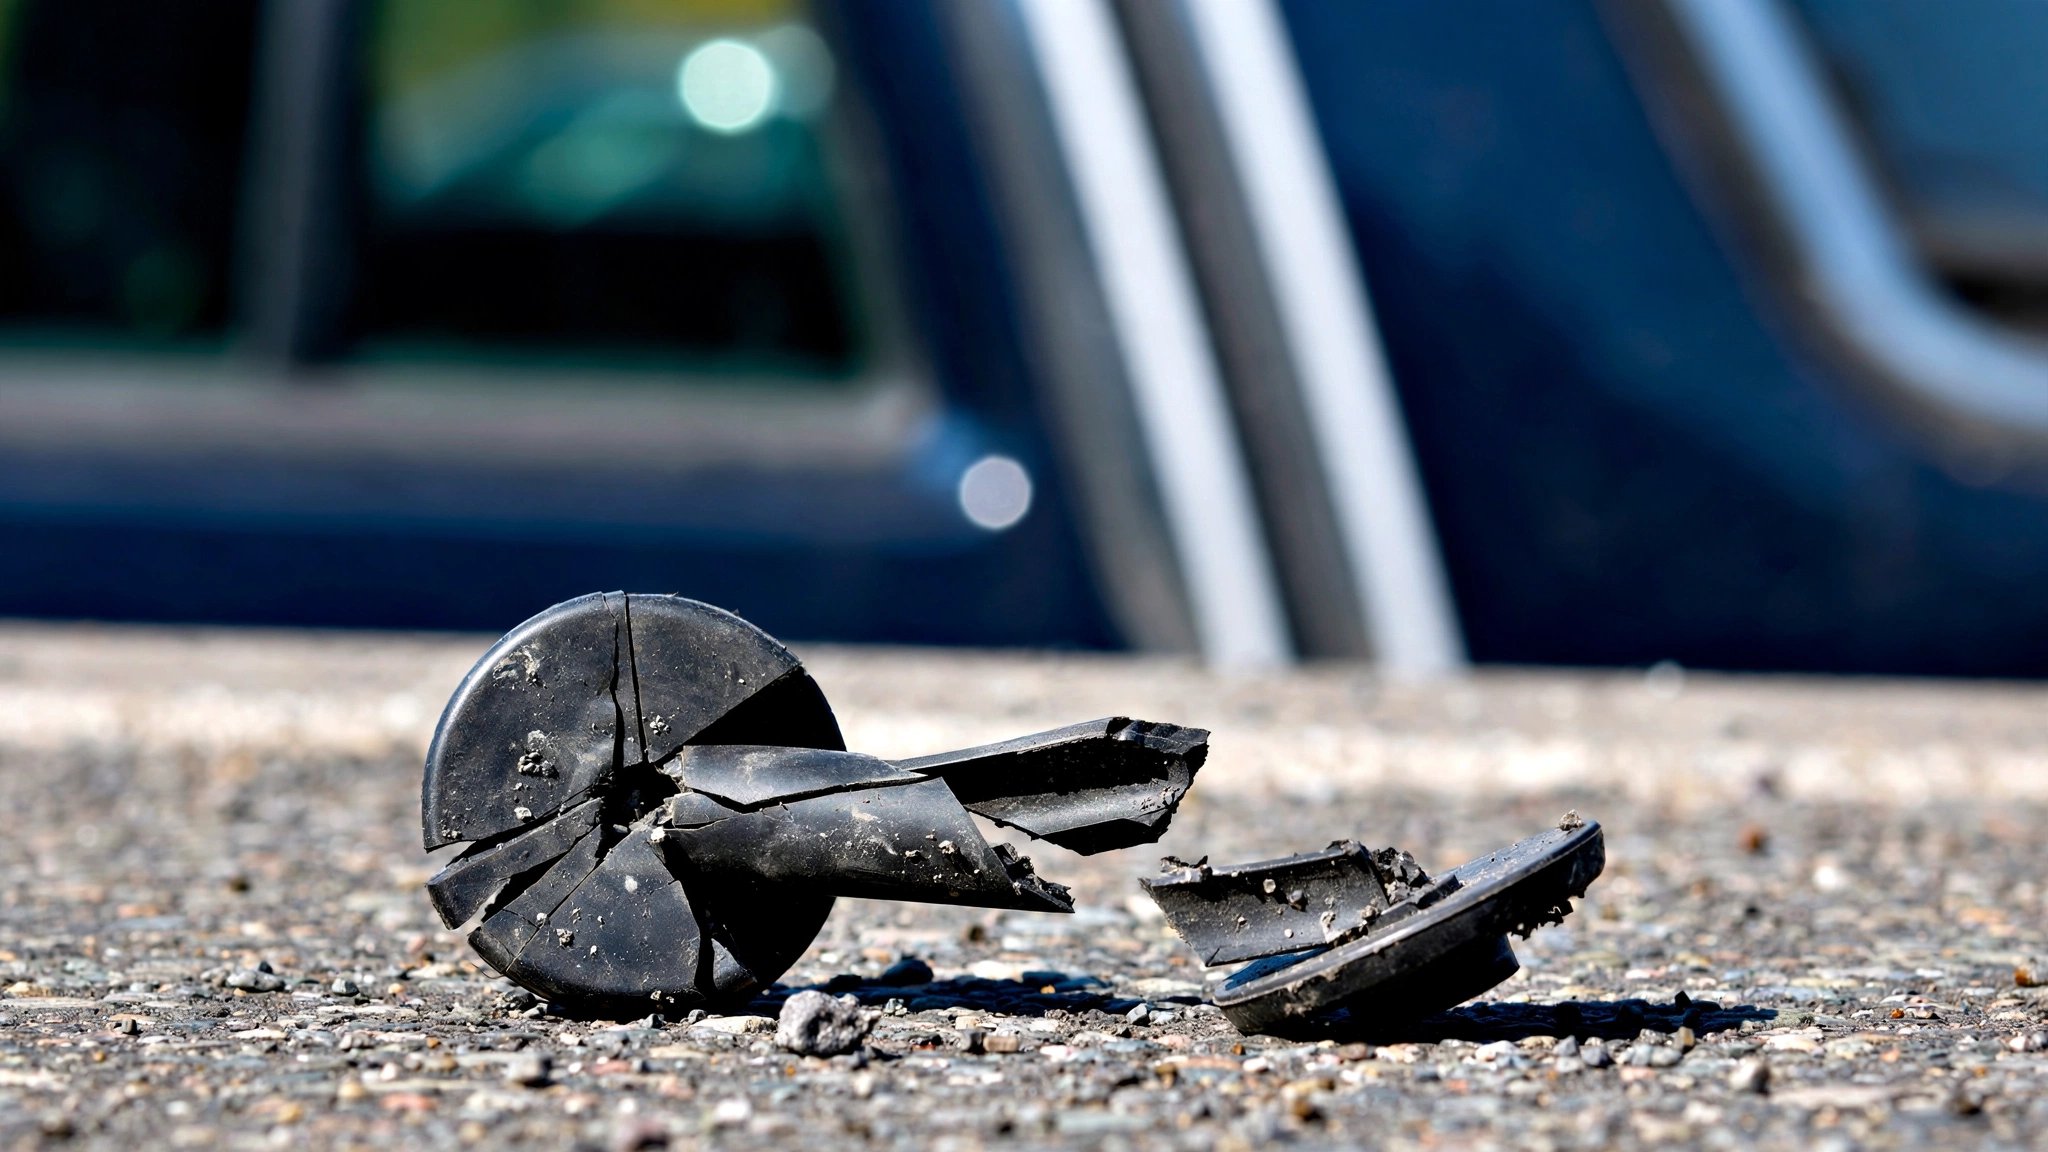
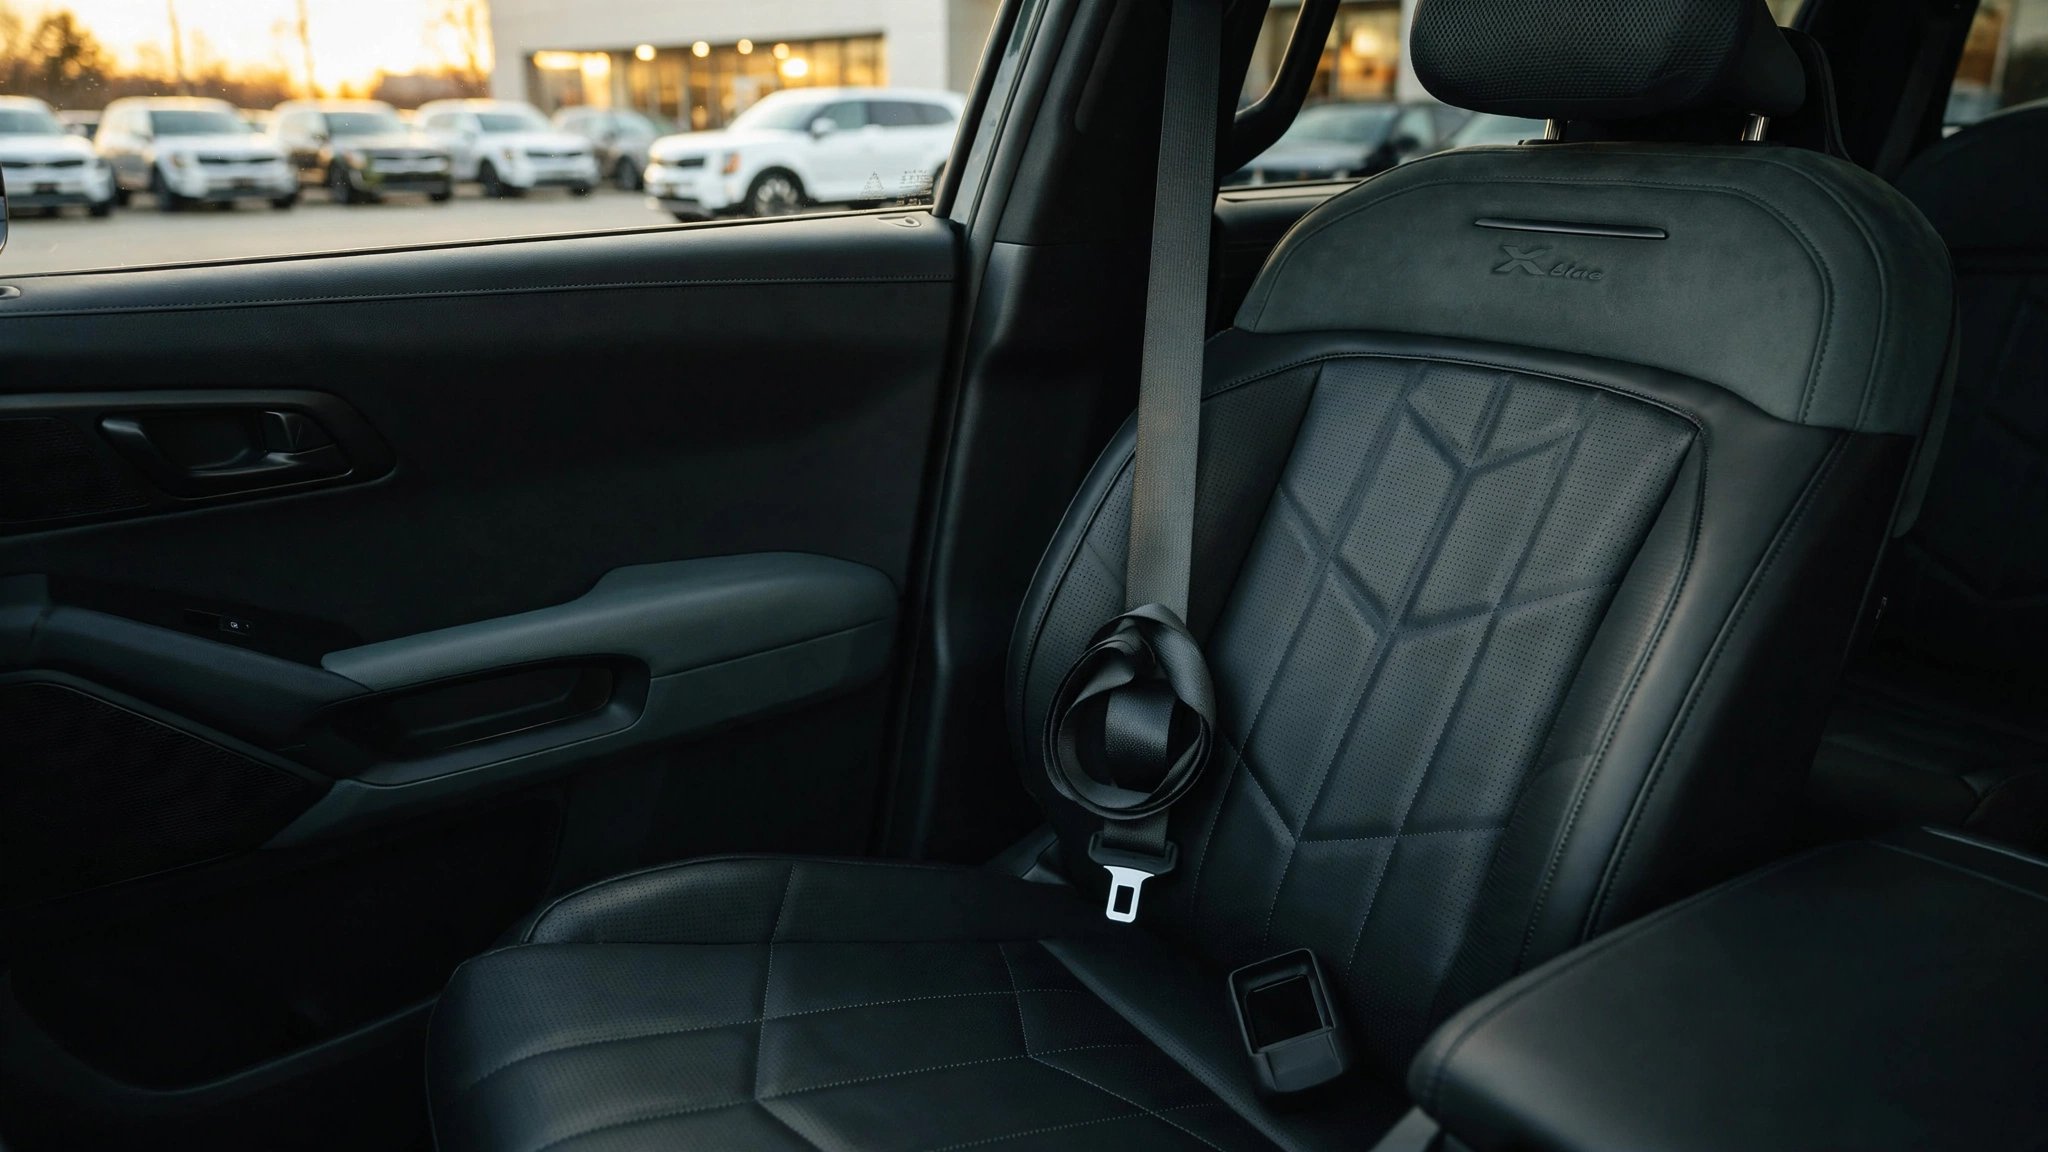
47,749 Hyundai Konas Have a Seatbelt That Might Not Work. It’s in the Seat Nobody Tests.
Hyundai recalled the rear center seatbelt buckle in the Kona. No crash test protocol on Earth puts a dummy in that seat. The most neglected position in the car just got a reminder of why.

Subaru Just Recalled 541,000 Vehicles. The Fix Is a Sticker.
541,237 SUVs recalled for a wrong weight label. The remedy: paste a corrected sticker over the old one. In the NHTSA database, this counts the same as a recall that killed 27 people.

1,103 Cyclists Died Last Year. Nobody Can Tell You How Many Were on E-Bikes.
NHTSA reclassified e-bikes out of its crash database at the exact moment e-bike deaths started surging. Now 1,103 pedalcyclist deaths hide two opposite trends.

Every Age Group Got Safer in 2025. If You're Over 65, None of It Applies to You.
519 excess senior deaths. Zero percent improvement. The safety gains everyone else is celebrating don't extend past 65.

Your Car Produces Carbon Monoxide. It Has No Detector. NHTSA Has Known Since 1993.
NHTSA knew a $5 CO sensor could save hundreds of lives per year. Thirty-three years later, five people are dead in Toledo and your car still can't tell you it's poisoning you.

Robotaxis Can't See Fire Trucks. NHTSA Had to Write Them a Letter About It.
The head of NHTSA told the entire AV industry their cars drive into fires, block ambulances, and ignore school buses. The consequence? A meeting request.

One Supplier Makes 30% of the World's Seatbelts. It Can't Stop Failing.
Joyson Safety Systems inherited Takata's factories and market dominance. Eight years and six failure modes later, 87 million US vehicles carry their restraint hardware.

Your Tires Were Tested Once. When They Were New.
The EU now requires tires to prove wet-grip performance when worn. The US tests them only when brand new. 600 Americans die in tire-related crashes every year.

Ford Fixed 615,000 Explorers’ Flying Roof Rails. NHTSA Just Found Out They Didn’t.
Ford recalled 615,000 Explorers in 2021 for roof rail covers that detach at speed. The epoxy fix failed. Now 288,000 more are recalled—for the same defect.

‘Park Outside.’ 1.5 Million Vehicles Got That Order in 30 Days.
Two recalls, 30 days, 1.54 million Jeep Wranglers and Kia Tellurides exiled from garages. One fix failed. The other doesn’t exist yet.
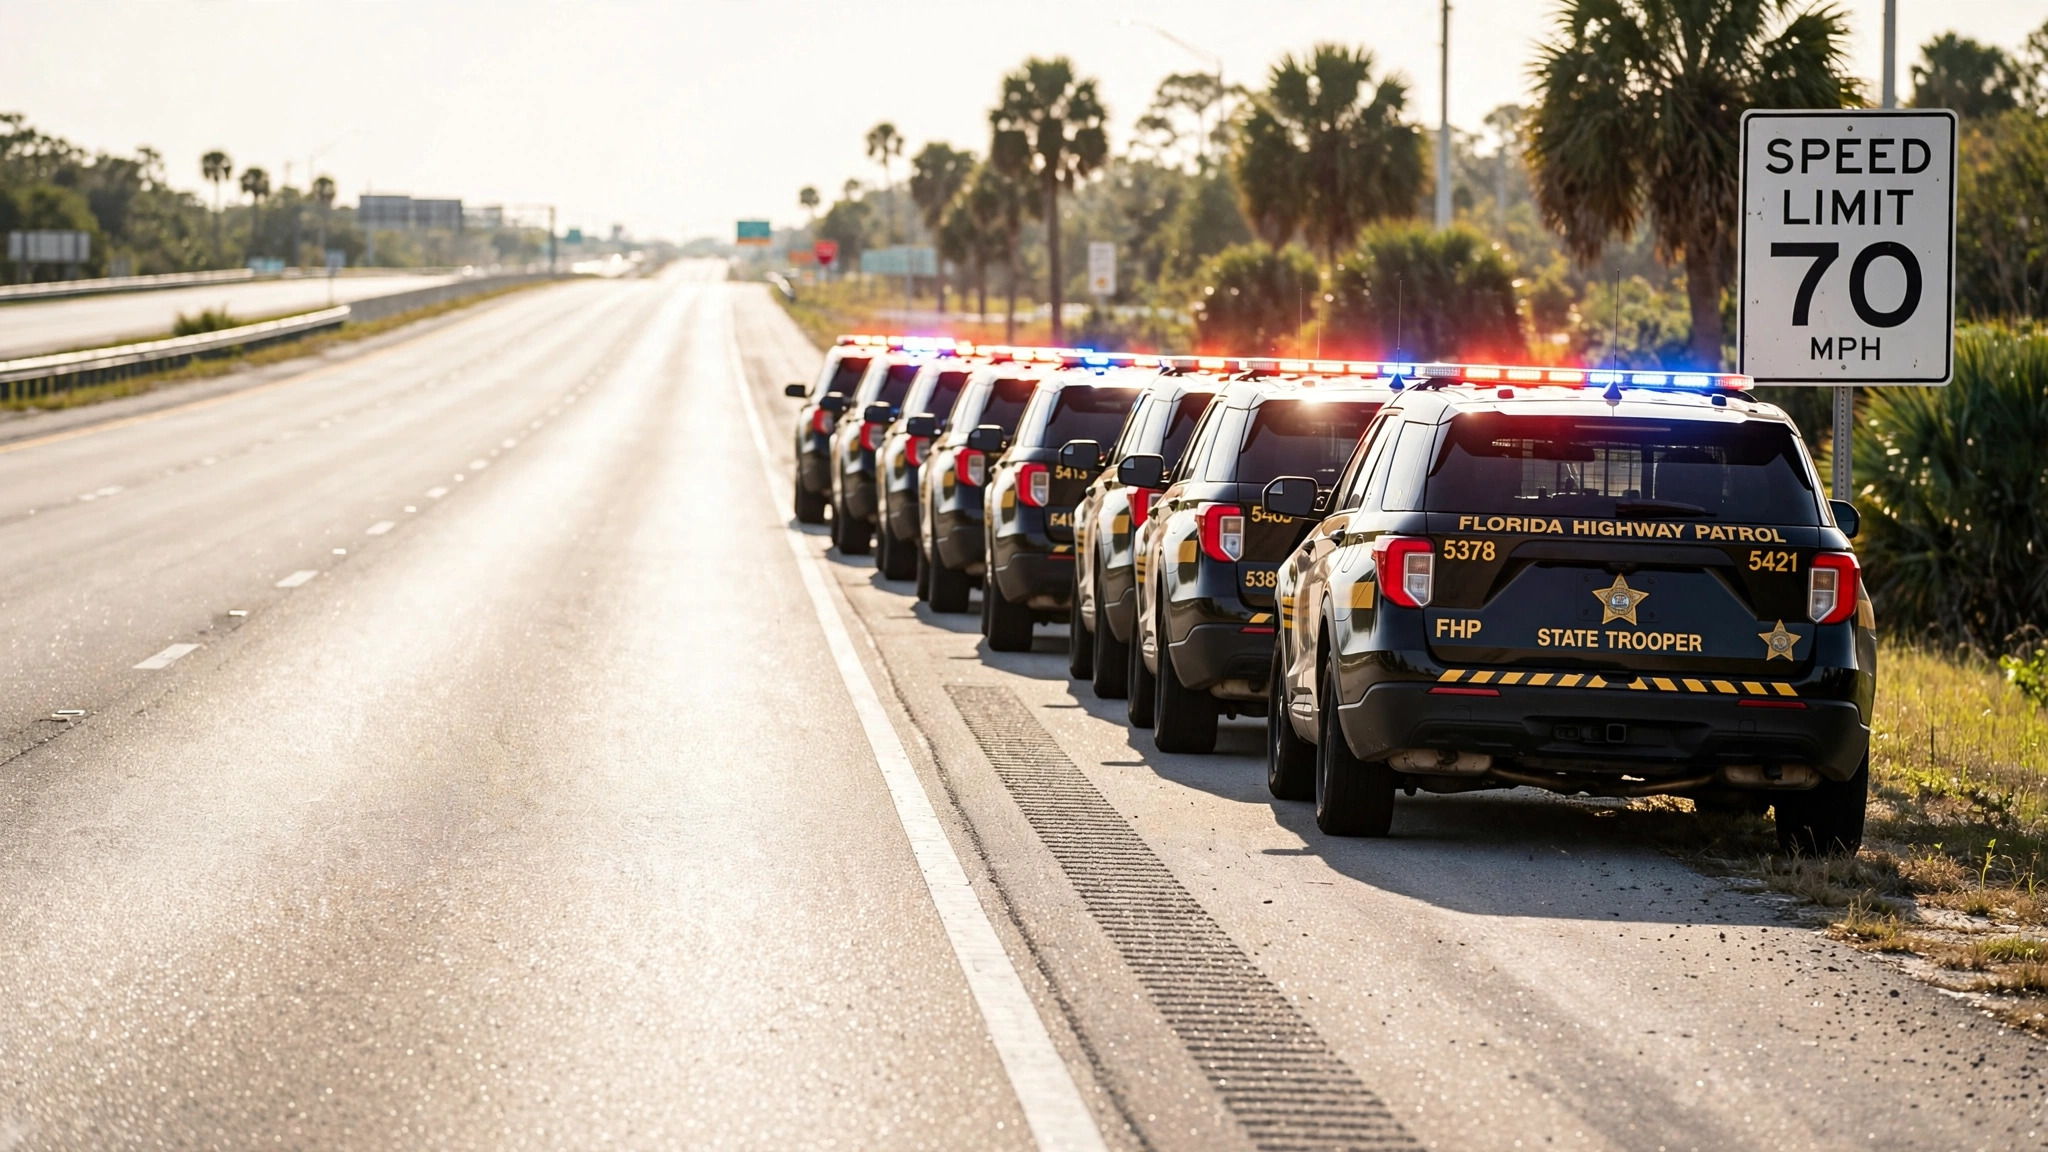
Operation Southern Slow Down Ends Today. Florida Has the Lowest Speeding Death Rate in America.
A five-state anti-speeding blitz wraps up in the one state where speed is least likely to kill you. FARS data shows vehicle choice creates a 94x death-rate gap that no traffic stop can close.
America Didn’t Get Safer. Its Cars Just Got Harder to Die In.
Road deaths fell 4% in 2024 while 2.42 million injuries barely budged. Fleet turnover explains the divergence: 78% of fatal-crash deaths involve vehicles from before the modern safety era.

NHTSA Spent $665 Million on Speed Campaigns. Virginia Just Made a Judge Do It Instead.
Virginia’s new ISA law puts GPS speed limiters on reckless drivers’ cars. NHTSA’s plan for 10,035 annual speeding deaths: a month-long ad campaign and $665M in grants.

Every Crash Test Dummy in the World Is Sitting in a Position You Won’t Be In
AEB brakes at up to 1g before a crash, lurching you forward by up to 400mm. Every safety rating was earned with the dummy sitting still. Three 2026 SAE papers say the gap matters.

The Most Common Car Injury in America Wasn’t Being Properly Tested Until January
IIHS upgraded its whiplash test to 30 mph. Of the first 18 SUVs tested, 78% failed to earn a Good rating. The vehicles that passed have FARS fatality rates half those that didn’t.

He Googled ‘FSD Not Aggressive Enough.’ Then He Overrode It at 73 in a 30.
A DoorDash driver frustrated with FSD’s conservative driving Googled for workarounds. The NTSB confirms he then floored the accelerator to 100% in a 30 mph zone, killing a 76-year-old woman. The override architecture let him.

October Kills More American Drivers Than Any Other Month. Nobody Runs a Safety Campaign.
October produced 3,505 fatal crashes in 2023—12% above average. It’s the deadliest month in 22 states. Summer gets the PSAs. October gets the body bags.

A Thousand Experts Just Named Your Car’s Best Safety Feature Its Biggest Threat
A global survey says ADAS misuse is the #1 road safety risk. FARS data shows brands with the most ADAS have death rates up to 22× lower. Both are true. The paradox is the story.
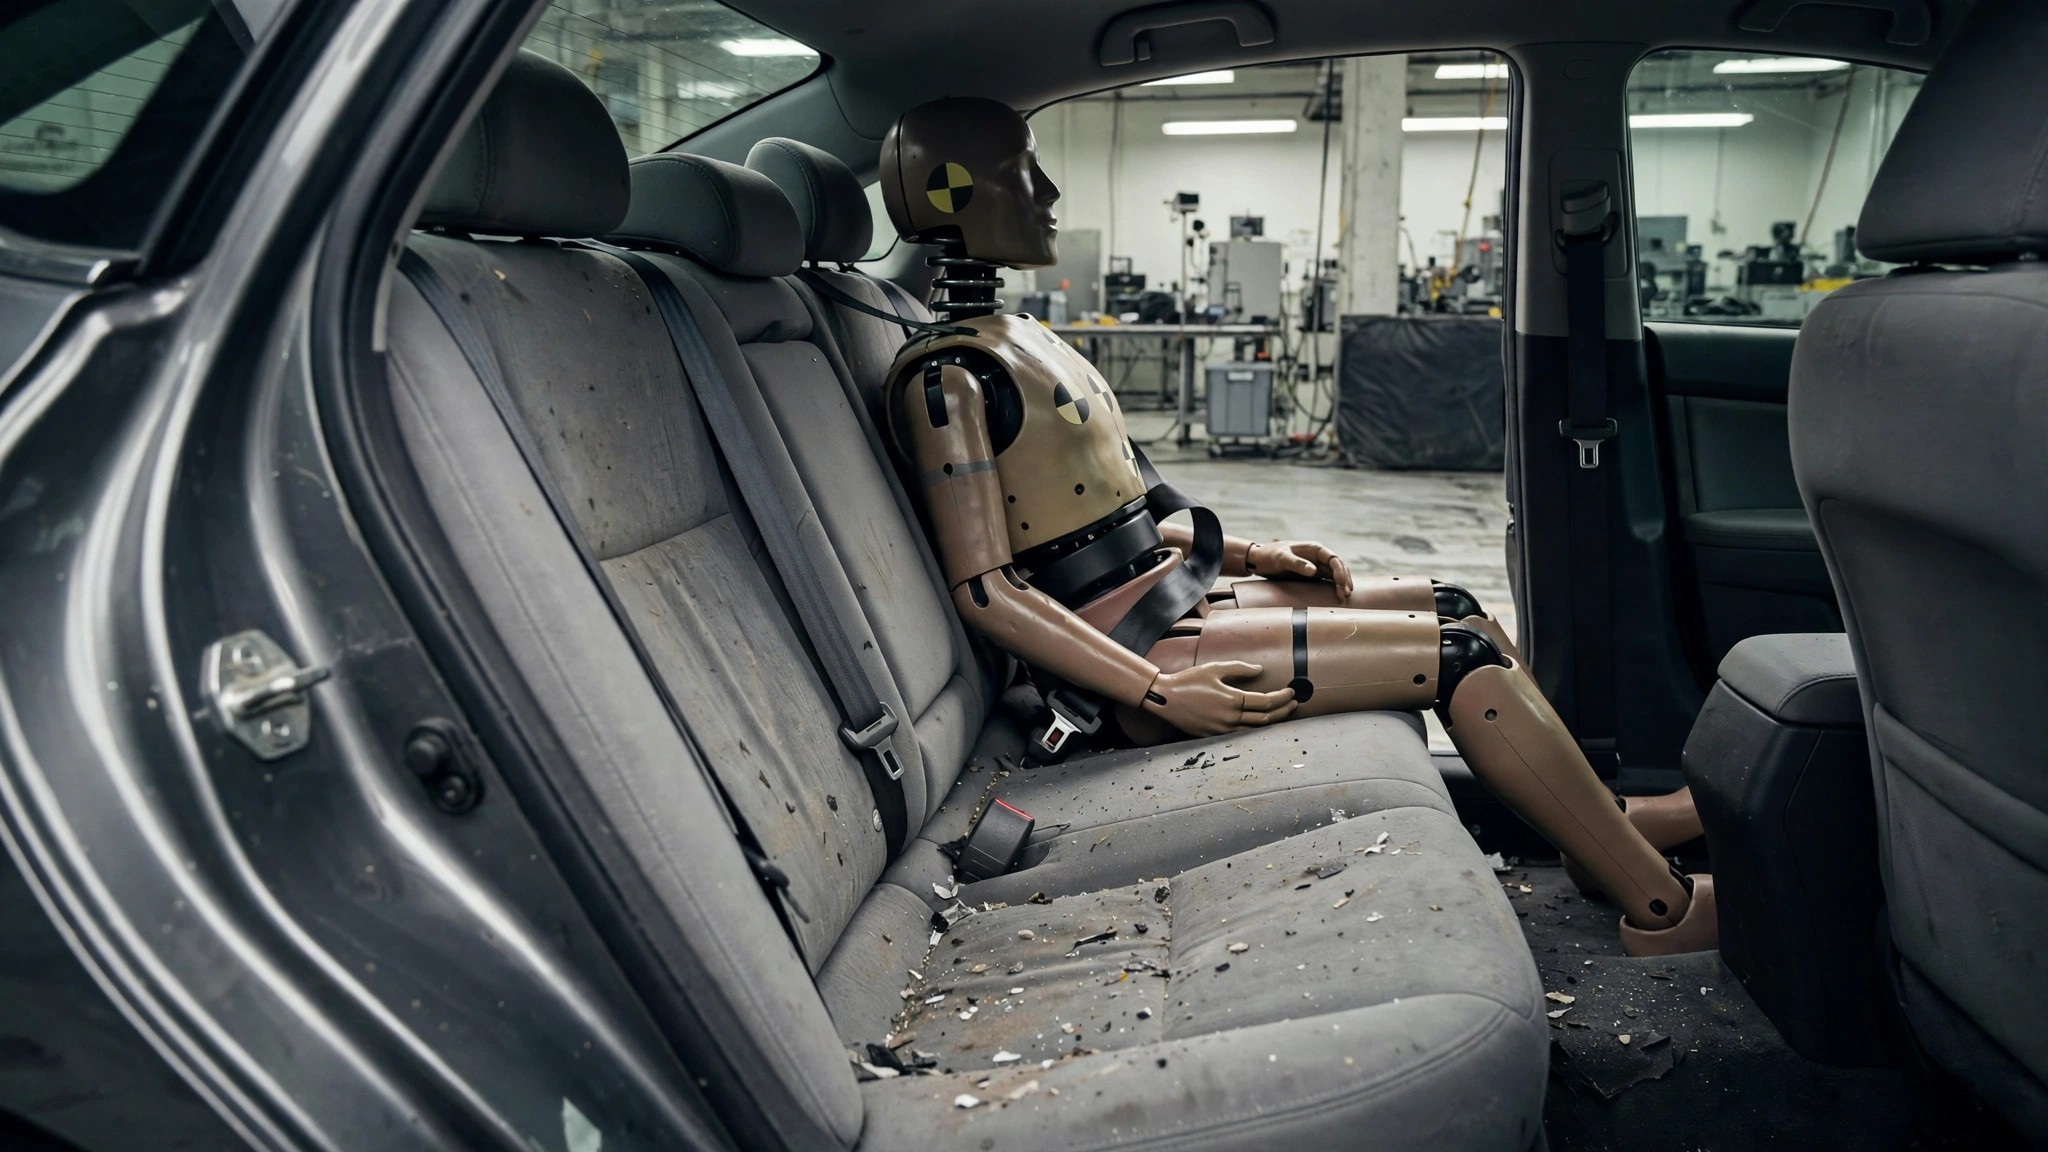
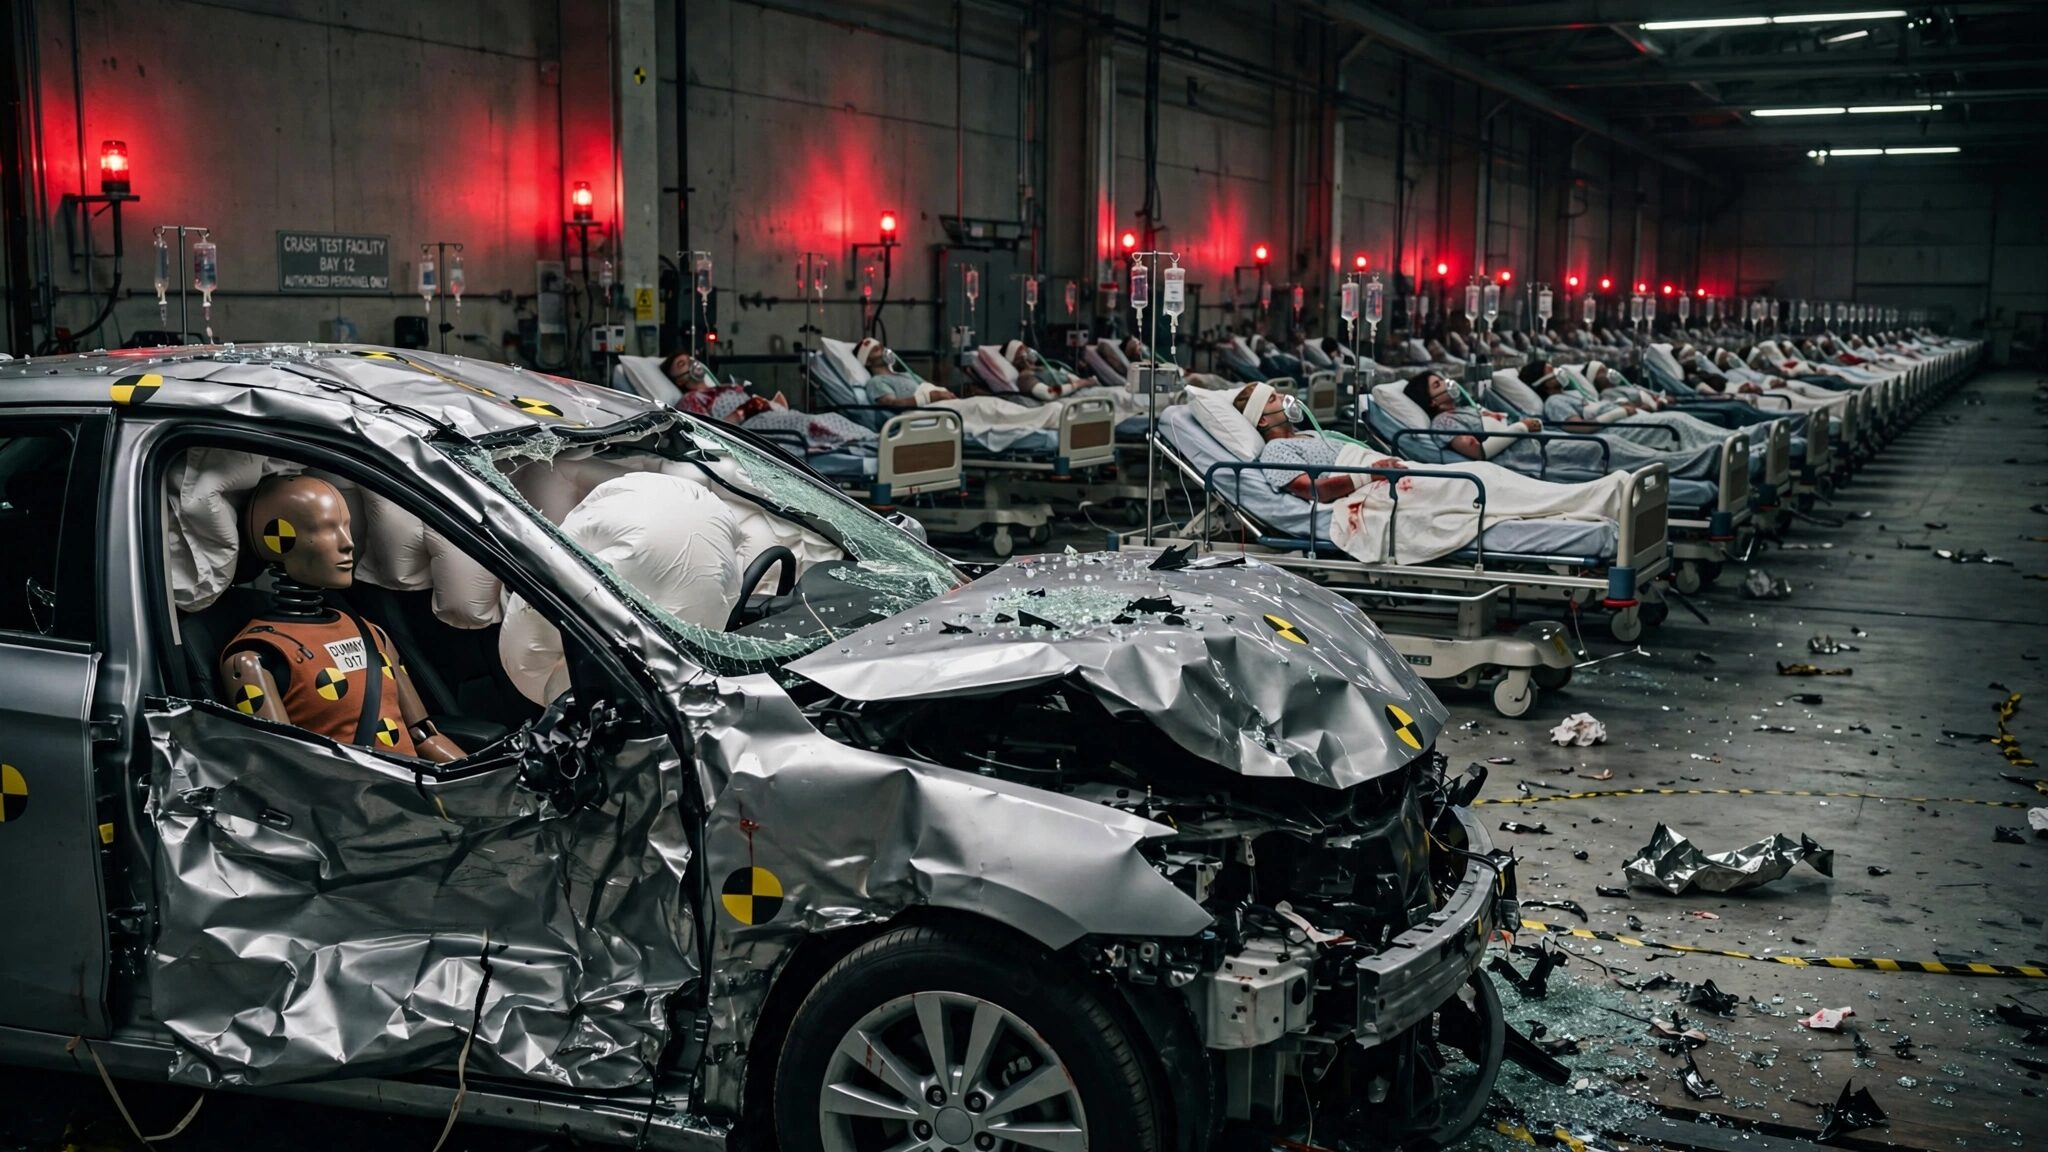
25,441 People Died in Cars That Just Failed a Test Nobody Was Running
IIHS finally put a crash-test dummy in the back seat. Most of America’s best-selling vehicles failed. FARS data shows what three decades of not checking cost.

The Crosstrek’s Battery Pack Just Outperformed Its Engineers
IIHS tested the same Subaru Crosstrek with two powertrains. The hybrid scored “good” where the gas version scored “marginal.” The battery changed the crash structure, not just the fuel bill.

The Nation Hit a 5-Year Low for Road Deaths. California Got 39% Worse.
NSC data shows the national fatality rate hit 1.06 per 100M VMT in April 2026. California added 243 extra deaths in four months. The weakest DUI laws in the nation are doing exactly what you’d expect.

America’s Road Deaths Dropped 6.7%. One Category Got Worse.
NHTSA’s 2025 subcategory report shows every metric improving — urban interstates, nighttime, rollovers, ejections. Rural interstates went up 1%. The reasons are structural.

The Brand Lethality Index: Ranking Every Automaker by Whether You Survive the Crash
FARS data reveals a 2.42x gap in crash survivability across brands. Pontiac kills 74% of the time. Ram: 30%. Honda is sixth-deadliest.

72% of America’s Road Deaths Happen in Cars Too Old for Stability Control
NHTSA’s 2025 report shows the biggest fatality drop in a decade. FARS model-year analysis reveals nearly three-quarters of deaths still occur in pre-2012 vehicles that never had to pass a stability control test.

GM Killed the Spark and Sonic. The Replacement Cuts Fatal Crashes 83%.
The Spark was America’s cheapest new car at $13,600 with a 74% crash lethality. The Trax crossover that replaced it has double the fleet and 63% fewer deaths.

Tesla Said Its Headlights Were “Inconsequential.” NHTSA Recalled Them Anyway.
NHTSA forced a recall on 19,900 of the safest vehicles in America for headlights that never caused a crash. The Chevy Impala kills at 100× the rate and violates no federal standard.

One Brand, Two Vehicles, a 13× Death-Rate Gap
Mazda was just named the safest brand in America. Its CX-5 kills at 0.12 per 100M VMT. Its Mazda3 kills at 1.63. Same badge. Same showroom. 13.6 times the fatality rate.

Consumer Reports Ranked Lincoln the Fourth-Safest Brand in America. The Federal Body Count Disagrees.
CR's first-ever Safety Verdict put Lincoln above Toyota, Honda, and Volvo. FARS says Lincoln's death rate is double Acura's and 72% worse than Mazda's. Same tier, different morgue counts.

Honda Built the Safest Family SUVs in America. Their Subframes Were Painted Wrong.
880,514 Pilots, Ridgelines, Passports, and MDXs recalled for subframe corrosion. FARS says they're the safest family SUVs on the road. Crash tests measure the ceiling. Road salt measures the floor.

Ford Killed Its Safest Mainstream SUV. The One 3× Deadlier Lives On.
The Edge died in 2024 with a 0.46 death rate. The Explorer Ford kept posts 1.54. Same drivers. Triple the body count per mile.

50 Investigations Later, Nobody's Asking Why FSD Stepped Aside at 70 mph
NTSB cleared Tesla's FSD in the Katy crash. But the override architecture that handed full control to a driver doing 70 in a 30 zone was never on trial.

Traffic Deaths Dropped 4%. Two Age Groups Got Worse.
Every age bracket between 15 and 64 saw fewer deaths in 2024. Children under 15 and adults over 65 added 173 fatalities. Vehicle age explains why.

The Kia Forte Failed Two IIHS Crash Tests. FARS Says It's the Safest Compact Sedan in America.
Poor in two updated IIHS tests. Lowest death rate of any compact sedan at 0.40 per 100M VMT. The Civic kills at 5.6× the rate. Both datasets are correct.

The Second-Safest SUV in America Can’t Get an IIHS Award
The Traverse posts 0.20 deaths per 100M VMT, second only to the RAV4. IIHS denied it any 2026 safety award. The Explorer kills at 7.7× the rate. Nobody seems to care.

GM Built the Deadliest Compact Pickup in America. Then It Built the Safest.
The S-10 kills at 4.83 per 100M VMT. Its replacement, the Colorado, sits at 0.28. Same company, same segment, and a 17.3× death gap.

Lexus Sells Seven Models. The Flagship Kills at 29× the Rate of the Starter SUV.
The $80,000 LS has a fatality rate of 1.44. The $38,000 NX sits at 0.05. Same brand, same dealership, same Toyota DNA. The gradient is monotonic.

The $48,600 Cadillac CT5 Failed Four IIHS Tests. Its Predecessor Had the Most Impaired Drivers in Luxury.
Poor in side impact, front overlap, headlights, and crash prevention. FARS data shows the CTS — which the CT5 replaced — had the highest impairment rate of any luxury sedan.

The Cheapest Audi Has the Drunkest Drivers in the Luxury Segment
27.1% of Audi A3 drivers in fatal crashes were impaired — 5.4 points above the entry-luxury average. Then IIHS downgraded it to Basic.

1,303 People Died in a Chrysler Town & Country. The Van That Replaced It Kills 85% Fewer.
Chrysler sold its premium minivan for 20 years on the same platform. The Pacifica replacement cut the death rate from 1.26 to 0.19. That’s 1,283 deaths the platform didn’t need to produce.

Hyundai Recalled 14 EVs for Zero Fires. Their ICE Fleet Has Killed 9,931 People.
Hyundai-Kia recalled exactly 14 electric vehicles for a battery defect that hurt nobody. Their gasoline cars have 9,931 FARS fatalities. That’s 709 deaths per recalled EV.

The Vehicles That Crash the Most Have the Soberest Drivers
Pearson r = −0.23 across 298 vehicle models. The most crash-prone vehicles in FARS have below-average impairment rates. Sobriety doesn’t save you from bad design.

Range Rover’s Steering Can Snap Off. Land Rover’s Fix Is a Brace.
522 steering knuckle fractures across nine model years. A recall covering four. NHTSA escalated to Engineering Analysis after calling JLR’s data “contradictory.”

Toyota’s Safest Family SUV Has a Rear Axle That Can Break
Toyota recalled 5,408 Grand Highlanders and Lexus TXs for rear axle carriers that can crack from the factory. FARS data reveals the Highlander sits mid-pack, not best-in-class, for three-row SUV safety.

LendingTree Ranked America’s Most Aggressive Vehicles. They Forgot to Divide.
The Silverado and F-150 are underrepresented in aggressive-driving crashes per fleet size. The Dodge Charger, buried at #11, runs at 2.28× the expected rate.

Every Competitor Got Safer. The Nissan Sentra Got Worse.
From MY2015 to MY2019, the Corolla dropped 46% and the Elantra dropped 13%. The Sentra rose 63%. Seven model years on the same platform.

1,253 Fewer Americans Died Speeding in 2025. The Speed Limits Didn’t Change.
Speeding isn’t a speed problem. NHTSA’s own data shows half of speeding fatal-crash drivers were unbuckled and 37% were drunk. The 11% decline is a behavioral cluster story.

Subaru Recalled 541,237 of Its Safest Cars. The Fix Is a Sticker.
Zero crashes, zero injuries. The recall system moves at light speed for label typos and at geological pace for airbags deploying into passengers.

Two-Thirds of Safety Experts Say Car Tech Ads Are Lying. The Math Says They’re Being Generous.
1,000 transport specialists say ADAS ads overstate capabilities. EU research shows all that tech combined saves 6%. AEB does 83% of the work and costs $0.

The Cadillac CT5 Got Five Stars and Four ‘Poors.’ Both Are Correct.

BMW Recalled 29,119 Hybrids for Fire Risk. The Part That Failed Doesn’t Exist in an EV.

For Every Death, America Recalls 1,319 Vehicles. It’s Not Working.

Switching From a Sedan to an SUV Makes You 9x Safer — Unless You Buy the Wrong Brand

58,186 Americans Died Because They Picked the Wrong Model. Not the Wrong Class. The Wrong Model.

Passenger Deaths Dropped 44% in 30 Years. Driver Deaths Dropped 13%. Nobody Noticed.

GM Killed Seven Sedans. Those Sedans Have Killed 7,370 People Since.

Utah Has Zero Road Rage Deaths. Arkansas Has 258. Neither Number Is Real.

Ford and Tesla Recalled 1.3 Million Vehicles This Month. One Brand Kills at 19× the Rate of the Other.

The Pontiac Vibe and Toyota Matrix Are the Same Car. One Has Killed 22 Times as Many People.

IIHS Just Rated 14 Vehicles. The Failures Kill at 5× the Rate of the Winners.

The Civic Gets Safer Every Generation; the Forte Gets Deadlier

The 2001 Ford F-150 Has Killed More People Than Any Other Vintage in America

Five TSP+ Winners Have Above-Average Death Rates. Every Vehicle That Failed Has a Below-Average One.

In 2021, SUVs Started Killing More People Than Sedans. The Safety Narrative Didn’t Update.
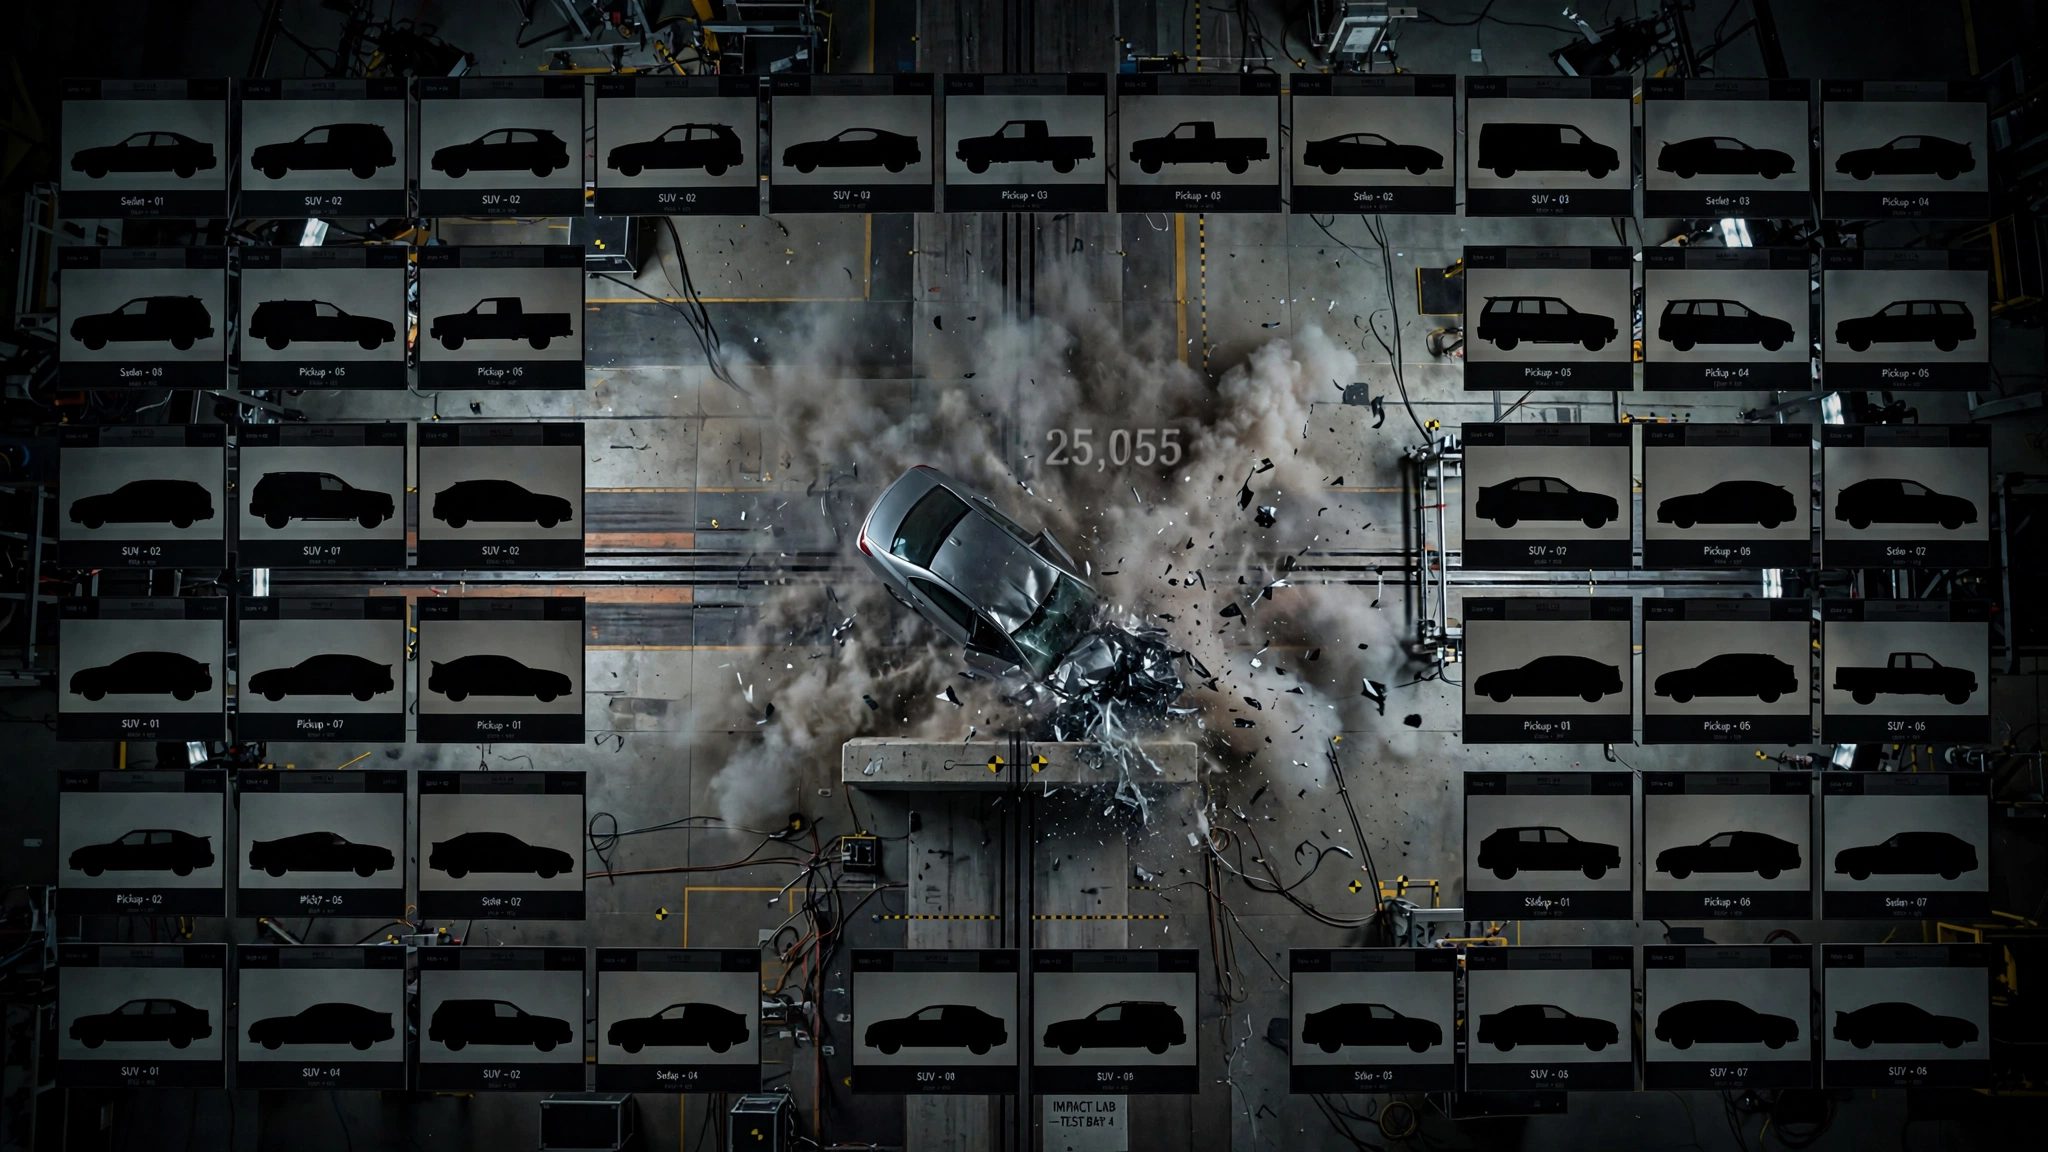
The 25,055 Deaths Behind NHTSA’s 2026 Crash Test List
We cross-referenced NHTSA’s 37-vehicle test list with FARS fatality data. The death rate spread across vehicles getting the same star-rating treatment: 71 to 1.

Every Vehicle Has a Single Worst Year. For 23 of Them, It’s 2004.
Model Year 2004 is the peak death vintage for 23 separate vehicles in FARS data, producing 3,158 fatalities. The next-worst vintage claims 15. Three forces converge on one model year.

Out-of-State Travel Deaths Dropped 12%. Every Other Category Wishes It Could Keep Up.
The steepest decline in any NHTSA fatal crash category tells you exactly where safety tech actually works and where it doesn't.

36,640 People Died on American Roads in 2025. The Cars Didn't Get Safer.
NHTSA's 2025 full-year data shows the lowest fatality rate since before COVID. The vehicle fleet barely changed. The 2,614-death improvement is behavioral.

The 10 Soberest Vehicles in Fatal Crashes Are All Family Cars. 4,079 People Died in Them.
Rank every vehicle in FARS by impairment rate and the Subaru Ascent finishes last at 8.2%. The next nine are all family haulers too. Combined body count: 4,079.

The National Death Rate Is Falling. Pickup Trucks Are Eating the Difference.
Pickup occupant deaths rose 31% while sedan deaths fell 11%. Total change: −105. America rearranged the body count.

The Fatality Rate Just Dropped Below 1.0. You Should Not Be Celebrating.
NHTSA's Q1 2026 rate hit 0.99 per 100 million VMT. A masterpiece of denominator engineering. 86 people still died every day.

The Bronco Is Designed to Fall Apart. Two Recalls Later, It’s Working as Intended.
Ford recalled 52,000 Broncos for body parts detaching at highway speed. The roof and the fenders. On a vehicle designed to be taken apart. Nobody tests for this.

Your Car Won a Safety Award. Nobody Tested Whether It Can Stop Before Hitting a Semi.
The IIHS gives Top Safety Pick awards to vehicles never tested against semi-trailers, the crash type that kills 400+ Americans annually in underride collisions.

The Kia Optima Got Every Safety Feature Congress Mandated. Its Body Count Tripled.
FARS data shows 15 vehicles had higher average annual deaths in post-ESC mandate model years than pre-mandate ones. Safety tech works per mile. It didn't work per model.

GM Killed 1,540 People Before It Learned to Listen. This Week, Listening Saved One.
The Cadillac Vistiq recall proves GM's post-Cobalt safety culture works. FARS data reveals what that culture cost to build: 1,540 dead, a decade of silence, and one toddler who finally made an engineer speak up.

Iowa Just Added 5 MPH to Its Rural Roads. The Price Is About a Dozen Funerals.
IIHS data says each 5 mph speed limit increase costs 4% more traffic fatalities. Iowa averages 337 road deaths a year. Four percent of 337 is about 13.

The Kill Ratio: Your Car's Safety Rating Is Someone Else's Death Sentence
The Ram 2500 is involved in 748 fatal crashes. Its occupants die in 153 of them. Do the math on who's absorbing the rest.

Minnesota's Motorcycle Deaths Are Up 54%. Colorado Just Set a Six-Year Record. Nobody's Aggregating the Picture.
Three states are independently reporting worst-in-decades motorcycle fatality surges. No federal dashboard tracks it in real time. We built the table.

Your Car Needs Half a Mile of Your Attention to Change the Radio. A 2005 Volvo Needed 328 Feet.
Vi Bilägare’s 2026 repeat study shows touchscreen distraction distances are getting worse, not better. No safety rating on earth penalizes the difference.

NHTSA Celebrates a 0.99 Death Rate. Crashes Still Cost $1.77 Trillion. The 2.42 Million Injured Don't Make the Headline.
The fatality rate dropped below 1.0 for the first time in a decade. But 2.42 million people were injured in 2024, and the total cost hit $1.77 trillion. NHTSA doesn’t publish a quarterly injury rate.

Congress Passed a Law to Stop Hot Car Deaths. NHTSA Missed the Deadline by Three Years. Ten Children Are Dead.
Section 24222 of the 2021 Infrastructure Act gave NHTSA two years to mandate occupant detection. The deadline was November 2023. The rule doesn’t exist. Ten children have died in hot cars in 2026.

Kia Recalled 463,000 Tellurides for Fire Risk. The Fix Caught Fire.
462,869 Tellurides. Two recalls. Same fire defect. Kia’s engineering fix failed, and the new remedy is a fuse spliced into the seat motor circuit.

The Average Car in a Fatal Crash Was Built in 2007. A 25% Tariff Keeps It on the Road.
82.6% of FARS fatalities involve vehicles from 2014 or older. The fleet is 12.8 years old on average. A 25% tariff makes new cars harder to buy—and old ones harder to leave.

The Recall System Has a Defect: 39% of Fixes Never Happen, and Some That Do Don’t Work
NHTSA data shows only 61% of recalled vehicles ever get repaired. This week, Ram rollaways and Kia fires proved that even the “fixed” ones can fail.

NHTSA Called Autonomous Vehicles a “Danger to the General Public.” Three Weeks Ago, It Stopped Counting Their Crashes.
On June 16, NHTSA gutted the only system tracking AV crashes. On July 9, its administrator called AVs dangerous for blocking ambulances. The math doesn’t work if you stopped doing the math.

Ford Recalled 19.6 Million Vehicles Last Year. Then Won a Quality Award.
Ford issued 153 recalls in 2025 and 56 more in 2026. Then JD Power crowned them #1. FARS adds a third number: 34,954 deaths in a decade.

IIHS Just Tested Commercial Vehicles for the First Time. The Express Has Been Killing Drivers Without Force Limiters for 29 Years.
IIHS evaluated nine commercial vehicles on basic safety features. The Chevy Express, in production since 1996, still lacks force limiters. FARS records 475 deaths.

A Dead Child Made GM Check Its Own Seats. Nobody Made Anyone Else.
Three manufacturers recalled power-folding seats after a 2-year-old was crushed in a Palisade. At least 15 other SUVs with the same feature remain publicly untested.

EVs Have Fewer Moving Parts. One of Ford’s Just Broke.
Ford recalled 42,784 Mustang Mach-Es for a fractured rear differential pinion shaft. BorgWarner supplied it. The fix won’t be ready until December.

The Safest Vehicle in America Might Burn Down in Your Garage
The Kia Telluride’s 0.04 death rate makes it the second-safest vehicle by FARS data. Kia just recalled 462,869 of them for fire risk. FARS can’t see fire deaths.

Cannabis Just Passed Alcohol in Fatal Crash Toxicology. Nobody Has a Breathalyzer for It.
NHTSA’s trauma center study found cannabinoids in 25% of fatally injured road users, edging out alcohol at 23%. FARS vehicle data shows where the shift is already visible.

The Fatality Rate Just Broke Below 1.0. Motorcyclists Are Going the Other Direction.
Q1 2026 hit 0.99 deaths per 100M VMT — the safest quarter in a decade. Every subcategory declined. Except motorcyclists, who’ve tripled their death count since 1997.

The CT5 Scored POOR on Four IIHS Tests. NHTSA Gave It Five Stars. Same Car.
GM’s $48,600 Cadillac CT5 just earned the worst IIHS results of any vehicle in its test batch. NHTSA calls it perfect. The predecessor already had a 4x higher death rate than its competitors.

1,166 Cyclists Died in 2023. That’s the Worst Number Since 1980. Everyone Else’s Numbers Got Better.
Cyclist fatalities up 56% in a decade while overall traffic deaths fell. Three states account for 42% of the body count. The fleet got safer for the people inside it.

America’s Road Death Rate Just Broke Below 1.0. It Did the Same Thing in 2014.
Q1 2026 fatality rate: 0.99 per 100M VMT. Q1 2014 was also 0.99. Twelve years, 500 billion more annual miles, and the country matched a seasonal low it set a decade ago.

Stellantis Shipped 11,980 Grand Wagoneers With ESC Disabled From the Factory
Factory-installed software knocked out both ESC and brake assist in every 2026 Grand Wagoneer. IIHS says ESC cuts fatal SUV crashes by 56%.

Drunk Trucking Surged 26% in 2024. Nobody Else Got Worse.
NHTSA’s 2024 data shows alcohol-impaired truck drivers in fatal crashes surged 26% — the only vehicle category going backwards.

You’re 71× More Likely to Die in One Hyundai Than Another. Every Automaker Has the Same Problem.
FARS cross-tabulation reveals every manufacturer has a 10-70× internal safety spread. Brand loyalty is a safety gamble.

Toyota Fixed the Corolla’s Back Seat Twice. IIHS Still Gave It Nothing.
The safest of America’s Big Four sedans by fatality rate can’t earn even a basic safety award. Two redesigns later, the back seat is still Marginal.

The HR-V and Ram 2500 Both Kill at 0.13 per 100M VMT. Only One Is Actually Safe.
FARS data decomposes death rates into crash frequency and crash lethality. The results demolish the concept of a “safe car.”

NHTSA’s Budget Went Up 459%. Traffic Deaths Dropped 16%. The Automakers Did the Rest.
A peer-reviewed study finds America’s auto safety regulator has failed its core mission for 25 years while its budget ballooned. Every life saved was saved by manufacturers.

One Dead Toddler. Three Recalls. And Dozens of SUVs Nobody’s Checked Yet.
After a two-year-old was crushed by a power-folding seat, three automakers recalled 83,000 vehicles. There’s no federal standard for anti-pinch protection, and 20+ other SUV models haven’t been tested.

The Palisade Got IIHS’s Highest Safety Award. 68 Days After It Killed a Toddler.
IIHS runs six crash tests. Zero test for powered mechanisms that trap children. The award came anyway. Now three automakers and 83,000 vehicles share the same defect.

Ford’s $325,000 Track Car Just Got Recalled Because Its Wipers Don’t Work
Ford recalled 289 Mustang GTDs for wiper failure. The regular Mustang already accounts for 44.7% of all sports car fatalities in the U.S. at a death rate 8.7× higher than a Porsche 911.

It Took 11 Years to Require Electric Cars to Make Noise. Three Automakers Still Can’t Manage It.
155,000+ EVs and hybrids recalled because the federally mandated pedestrian warning sound fails. Ford, GM, and Mercedes each broke the same simple requirement differently. Meanwhile, 9.1 million pre-2021 EVs have no sound system at all.

NHTSA Had Four Years to Update Its Safety Ratings. Automakers Said No.
The Alliance for Automotive Innovation lobbied NHTSA to delay updated 5-star ratings from 2026 to 2027. Pedestrian AEB, blind-spot intervention, lane-keeping assist — all punted. A private nonprofit raised its bar on time. The feds folded.

Thirteen Quarters of Fewer Dead. The Last Streak This Long Took a Recession.
U.S. traffic deaths have declined for 13 consecutive quarters while VMT increases. Every prior streak like this required a recession that forced people off the road. This time, Americans are driving more miles and dying less per mile. That has never happened before.

Every New Car in Europe Will Brake for Pedestrians Tomorrow. America Won’t Require It Until 2029.
The EU mandates pedestrian AEB starting July 7. The US deadline is September 2029. During the gap, the country with the worst pedestrian death rate in the developed world will sell 50 million cars without the requirement.

For One Month, America’s Roads Were Safer Than Before COVID. Don’t Get Used to It.
March 2026 posted a 1.07 fatality rate per 100M VMT, the first monthly reading below the pre-COVID baseline of 1.13. But summer is coming, and seasonal data does not make an annual trend.

The Most Effective Safety Program in America Is a Car Crusher
65.4% of fatal-crash deaths involved pre-2010 vehicles. As the deadliest generation scraps at 5–6% per year, fleet turnover alone could explain the entire 2025 death decline.
A Plastic Clip Worth Pennies Has Generated Three Million Ford Explorer Recall Notices
Three recalls. Two suppliers. One failure mode. Ford's Explorer retention-pin design has produced ~3 million recall notices since 2021, and the B-pillar fix isn't expected until late 2026.

The Safest Sedan in America Has a 67-Death Blind Spot
The Prius kills at 0.55 per 100M VMT. But the 2010 model year has 67 FARS deaths — 2.98x its neighbors. Two brake recalls. One vintage. Zero attention.

Kia Sold the Forte With Poor Headlights for Six Years. The Fix Was in the Parts Bin the Whole Time.
IIHS rated the Forte's base-trim headlights Poor from 2019 to 2024. The LED fix was on the GT the whole time. Kia's solution was to kill the car.
The 2027 Kia Telluride Was Recalled Twice for Seatbelts Before Its First Oil Change
Two seatbelt recalls, one supplier, 21,134 vehicles affected. The Telluride's 0.04 FARS death rate assumes the belts work.

GM Killed Pontiac in 2010. The G6 Has Killed 908 People Since.
Every Pontiac G6 fatality in the federal crash database happened after the brand ceased to exist. At 69.9% lethality, the G6 is the deadliest mid-size sedan in its competitive class.

Six Months After Buying Takata, Joyson Built Airbag Inflators That Rupture
Joyson Safety Systems acquired Takata for $1.6 billion and promised “the highest quality.” Six months later, its factory built inflators now rupturing in parked GM trucks.

Four Recalls, One Failed Crash Test, Six Months: The Hyundai Tucson’s 2026
The 2025–2026 Tucson has been recalled four times for four unrelated defects and earned a POOR IIHS whiplash rating. It’s Hyundai’s best-selling vehicle.

NHTSA Cleared 1 Million Teslas in One Week. The Same Week, FSD Killed Someone.
NHTSA closed two Tesla safety probes covering 1,071,241 vehicles in six days. Its own findings identified Tesla’s design choices as the cause. Then it walked away.

Every Nissan Sedan Is Above the Death Rate Median. Every Single One.
13 of 19 Nissan models rank above their class median for fatality rate. The Maxima is 7.5× the sedan median. 14,456 people are dead across the lineup.

A 50-Cent Fuel Pump Part Has Been Stalling Toyotas for Six Years. The Recall Still Isn’t Done.
Denso’s defective impeller has triggered 5.8 million Toyota and Lexus recalls since 2020. The affected models account for 89.4% of every Toyota fatality in FARS.

Honda Specified the Wrong Paint on 880,514 Vehicles. Road Salt Is Finishing the Job.
A coating spec error left the rear subframe vulnerable to corrosion in 23 salt-belt states. The recalled models are among the safest in the FARS database. Honda estimates 1% are compromised. That’s 8,805 vehicles.

741,195 Fords Can’t Stay in Park. NHTSA Just Proposed Removing Brake Pedals.
Ford recalled three-quarters of a million vehicles for a rollaway defect the same week NHTSA proposed eliminating brake pedals from robotaxis. The defective fleet has driven 245× more miles than Waymo’s entire history.

The Toyota Highlander Saved Nearly 3,000 Lives. Nobody Noticed.
Toyota's Highlander and Ford's Explorer compete in the same showroom. One has a fatality rate 3.7 times higher. Nearly 3,000 people are alive because of that gap.

The GMC Envoy Won SUV of the Year. Then It Killed 988 People.
GM charged a premium to rebadge the Trailblazer as the GMC Envoy. Same platform, same crash structure, same body count. Motor Trend gave it SUV of the Year anyway.

Stellantis Vehicles Have Killed 23,295 People. The Company Might Not Survive to Fix the Problem.
Twelve percent of America’s traffic deaths belong to Stellantis. So does a €22 billion writedown, a securities fraud lawsuit, and a million Jeeps that catch fire while parked.

Ford Won JD Power’s Top Quality Award, Recalled 12 Million Vehicles, and You’re Supposed to Find This Reassuring
JD Power measures your first 90 days. NHTSA recalls measure the decade after that. Ford is winning one contest and losing the other.

NHTSA Says 38% of July 4th Drivers Killed Are Drunk. For the Corvette, It’s 26% on a Tuesday.
Five muscle cars operate at near-holiday impairment levels 365 days a year. NHTSA targets the calendar. The data says target the car.

America Turns 250. The Roads Have Killed 4 Million.
Since 1899, U.S. roads have killed approximately 4.1 million Americans, more than three times every military death in every war from Bunker Hill through Kabul.

Chrysler Renamed the Town & Country. The Death Rate Dropped 85%.
The Town & Country kills 130 people a year at a rate of 1.26. Its replacement, the Pacifica, manages 0.19. Same brand, same segment, 6.6× safer.

The Average Car on the Road Is 12.8 Years Old. So Is the Average Car in a Fatal Crash.
S&P Global says the average U.S. vehicle is 12.8 years old. FARS says the peak death bracket is 12–14 years. The safety features saving new-car buyers take a decade to reach the cars that actually kill people.

Allstate Just Ranked 200 Cities by Crash Risk. It Missed the Variable That Matters 16x More.
Allstate’s 2026 “Best Drivers” report shows a 4x gap between cities. FARS data shows a 16x gap between popular vehicles at the same dealership. Your car matters more than your zip code.

The 100 Deadliest Days Are Getting Safer. Unless You’re 16.
Summer road deaths fell 8.1% over two years. Teen driver fatalities rose 17.2%. The only age group getting worse is the one driving the worst cars.

Hyundai Sells a Car 142 Times Deadlier Than Its Safest Model. The Badge Didn’t Warn You.
Within a single brand’s showroom, fatality rates per 100 million VMT vary by over 100×. Brand loyalty is a safety myth the data demolished years ago.

Ford Will Spend Millions Telling You It’s #1 in Quality. It Recalled 8.9 Cars for Every One It Sold.
JD Power measures quality for 90 days. The average Ford has been on the road for 4,745 days. Ford’s new ad campaign is aimed squarely at the gap between those numbers.

Tesla’s Phantom Braking Complaints Dropped 99%. Its Lawsuit Exposure Grew to $14.5 Billion.
NHTSA closed four Tesla probes in 2026 as complaints declined. Courts opened billions in new litigation. Same technology, opposite conclusions.

NHTSA Wants to Remove the Brake Pedal. The Software Replacing It Has Been Recalled Five Times.
NHTSA proposes eliminating brake pedals from autonomous vehicles. Waymo’s software has been recalled five times in 28 months, including for passing school buses and driving into floods.

Honda’s Safest Vehicles Have an Asterisk. It’s Your Zip Code.
The Pilot kills at 0.29 per 100M VMT. But in 23 salt-belt states, 880,514 of Honda’s safest SUVs and trucks have rear suspensions that may corrode until the wheels come loose.

Since 2020, Automakers Have Told 11 Million Vehicle Owners to Park Outside. That’s the Fix.
More than 90 recalls have instructed owners to park outside due to fire risk. Samsung recalled every Note 7. The auto industry tells you to use your driveway as a safety feature.

Allstate Says Brownsville Has America’s Best Drivers. Federal Data Says Texas Kills 2.5x More Per Mile Than Massachusetts.
The 2026 Allstate report ranks cities by collision frequency. FARS ranks states by death rate. Three Texas cities top the “safest” list while their state kills at 2.45x the Massachusetts rate per mile driven.

Three Million Vehicles Got Recalled in One Week. Every Automaker Said ‘Only 1% Are Affected.’
Ford, Stellantis, Honda, and Hyundai filed recalls covering 2.8 million vehicles in three weeks. Every filing cited nearly identical defect estimates. FARS data on these same models tells a different story about what “1%” actually means.

Ford Replaced Its Safety Inspectors With AI. Then Hired 350 of Them Back.
Ford installed 900 AI cameras, lost its veteran engineers, and watched recalls spike to 153 in one year. Now it’s rehired 350 gray beards. The company behind 18.3% of U.S. traffic fatalities had automated the people who catch defects.

Congress Mandated a Tire Safety System That Warns You After the Damage Is Done. 600 People Die Every Year Anyway.
The TREAD Act mandated TPMS after the Firestone scandal killed 271 people. FMVSS 138 set the warning at 25% underinflation. The tire industry now admits that threshold is “often too late to prevent damage.” Over 600 still die annually.

NHTSA Says Enforcement Saved 2,614 Lives. The Fleet Math Says Otherwise.
NHTSA announced 36,640 traffic deaths in 2025, crediting law enforcement partnerships. FARS per-model data shows fleet turnover from high-rate sedans to modern crossovers did the heavy lifting.

The Chevy Equinox Has a ‘Fine’ Death Rate. 1,056 People Died Anyway.
A 0.36 rate sits below the SUV median. The CX-5 scores 0.12. Same class, 3× the gap, and ~700 excess deaths. The electric replacement has been recalled twice for the same pedestrian sound defect.

Three Out of Four Full-Size Pickups Can’t Protect a 12-Year-Old in a Crash
The F-150, Silverado, and RAM 1500 all fail or score poorly on the IIHS rear seat crash test. Only the Tundra passes. Ford hasn’t tried to fix it in three years.

Ford Won the Quality Award the Same Day It Recalled 741,000 Vehicles
JD Power crowned Ford the highest-quality mainstream brand on June 24. The same day, Ford filed a recall for 741,195 vehicles that won’t stay in park. One metric measures infotainment bugs. The other measures whether your car rolls into traffic.

Ford Has Recalled One Million Vehicles for Rolling Away. It’s June.
Two separate rollaway recalls in six months. Different platforms. Different transmissions. Same result: your Ford won't stay parked. The latest fix arrives in 2027.

Honda Knew Its Minivan’s Airbags Would Attack Passengers. It Waited Nine Years to Care.
440,830 Odysseys have airbag sensors that mistake potholes for crashes. Honda found the defect in 2021, fixed it in new cars, and told existing owners everything was fine.
The Model Year Lottery: Some Vintages Kill Three Times More Than Their Neighbors
FARS data shows 19 model years that are 2-3x deadlier than the years on either side. Nobody tells you which ones before you buy.

GM Has Built the Same Van for Thirty Years and Still Can’t Tighten a Nut
Four recalls in 18 months for the oldest vehicle in production. But the death rate says it’s one of the safest vans on the road.

Ford Has Recalled Five Million Vehicles Because They Can’t Stay in Park
Ford’s sixth major park-related recall since 2018 pushes the cumulative total past five million vehicles. Three different mechanisms, three drivetrains, one outcome.

At the Current Rate of Improvement, Vision Zero Arrives in the 23rd Century
NHTSA pledged zero traffic deaths. We projected the timeline from actual FARS data. At the post-2022 rate of decline, the number drops below one person around the year 2271.

Your Car Records Everything. Only the Manufacturer Gets to Read It.
Federal crash recorders capture 15 data points over 5 seconds. Modern ADAS vehicles record thousands of channels continuously. The manufacturer controls who sees them.

Your Car Will Be Recalled. The Math Says You Won't Fix It.
28 million vehicles recalled against 290 million registered. The per-vehicle lifetime recall probability is 70%. Half never get repaired.

It Took 14 Years to Require a Side-Impact Test for Your Kid's Car Seat. Do the Math on Who Paid.
Congress mandated side-impact testing in 2012. The standard takes effect December 2026. In between, roughly 52 children a year died in side crashes while strapped into seats never tested for them.

NHTSA Closed Two Probes Covering 817,000 Vehicles in One Weekend. Nobody Checked If the Fixes Work.
In 48 hours, NHTSA quietly shuttered investigations into Honda's exploding-on-potholes airbags and Tesla's vanishing power steering. A DOT audit says the agency takes 617 days to open a probe but can close one with a press release.

A Quarter-Million Land Rovers Have Airbags That Won't Fire. The Fix Is a Dab of Gel.
250,857 Defenders, Discoverys, and Range Rovers have a 100% defect rate for driver airbag non-deployment. The cause: normal driving vibrations corrode the clockspring connector. The interim fix: lubricant. No permanent solution exists.

Four People Oversee Whether 6 Million Teslas Can Drive Themselves. Congress Wants to Cut Their Budget.
NHTSA's autonomous vehicle investigation team went from seven people to four after federal workforce cuts. Those four now oversee active safety probes covering 6.1 million Tesla vehicles. Congress proposed cutting the agency's budget by another $88 million.

NHTSA Closed Two Safety Probes on a Saturday Afternoon. Both Companies Had Already Recalled.
On June 27, 2026, NHTSA quietly closed investigations into 817,243 Tesla and Honda vehicles. Both manufacturers had already issued voluntary recalls. Tesla said the recall wasn't even in response to the investigation.

The NTSB Has Asked for a Phone Kill Switch Three Times. Apple Built a Dismiss Button.
In 2011, the NTSB recommended phone lockout technology that disables devices while driving. Apple shipped a notification silencer you dismiss with one tap. 42,463 distraction deaths later, nobody has built what was actually recommended.

$4 a Car Would Save 67 Lives a Year. NHTSA Has Been ‘Analyzing Comments’ for 18 Months.
Europe required cars to protect pedestrians' heads in 2005. NHTSA proposed the same rule in 2024. It costs $4 per vehicle. Twenty-year-old pickups already pass. It's still sitting in a comment docket.

100 Cars a Day Hit Buildings. FARS Counts 210 a Year.
Up to 2,600 vehicle-into-building deaths per year. FARS reports 210. A 76-year-old woman dies inside her own home. The data gap is killing people we refuse to count.

170 Million Miles of Proof That Robots Drive Better. Then Someone Moved a Cone.
Waymo's 92% safety improvement is real, peer-reviewed, and statistically significant. It also doesn't cover the environment that kills 850 people a year.

Two Chips Fought Over a Memory Address. 20,991 EVs Can Lose Power at Highway Speed.
A firmware race condition in the battery ECU can kill drive power at 70 mph. Dijkstra published the fix in 1965. Toyota shipped without it in 2026.

Every Vehicle Class Has a Kill Rate. These Cars Blew Past It.
We computed expected deaths for every vehicle using class-average crash lethality. The Ford Ranger killed 902 more people than an average pickup would have.

NHTSA Called 39,345 Deaths ‘Encouraging.’ Norway Lost 89 People.
America’s traffic death rate is 2.6x the European average and 7x Norway’s. In a single year, 24,000 Americans die who wouldn’t if they lived across the Atlantic.

438 People Will Die This Weekend. Here’s When, Where, and in What.
NSC projects 438 traffic deaths over the July 4th 78-hour window. 38% will involve alcohol. FARS toxicology data reveals which vehicles carry the highest impairment risk.

787,000 Vehicles, One Month, One Failure Mode: Your Safety Net Is a Light Switch
Four manufacturers recalled 787,193 vehicles in June 2026 for electronic safety failures that work perfectly or not at all. One architectural pattern, four ways to die.
The Brand Badge Is a Lie. Your Model Choice Is a 39x Safety Gamble.
FARS data reveals fatality rate spreads up to 39x within the same manufacturer. Choosing the right Toyota matters more than choosing Toyota over Kia.

The Same ECU Bug Hit Toyota, Lexus, and Subaru at Once. That’s Not a Coincidence.
A single Denso memory chip defect triggered recalls across 20,991 EVs spanning three brands on the e-TNGA platform. It’s the architecture’s second cross-brand recall in two years.

Your Minivan’s Airbags Can Fire From a Pothole. Honda Knew for Four Years.
Honda recalled 440,830 Odyssey minivans after side curtain airbags deployed from potholes. The company identified the defect in 2021, fixed production in 2022, and didn’t recall vehicles already sold until NHTSA forced the issue.

$12,409 Per Life. The Insurance Industry Accidentally Built the Best Safety Program in America.
IIHS spent $600 million over 30 years and saved 48,352 lives. That is $12,409 per life—0.1% of what the DOT says a life is worth. The government spent $92 million on alcohol detection and saved nobody.

Same Death Rate. One Kills Its Driver 92% of the Time.
The Saturn S Series and the Toyota Tundra have nearly identical fatality rates. But when a fatal crash happens, the Saturn's occupant dies 92% of the time. The Tundra's? 42%. The standard safety metric hides a 4.5× gap in who actually dies.

The Nissan Rogue Killed 127 People in Its Worst Model Year. The RAV4 Never Broke 88.
Four consecutive model years above 100 fatalities. The Rogue's T32 platform sustained a death plateau no compact SUV competitor matched.

Every Vehicle Category Got Safer in 2024. Except the One You Bought.
Cars fell 9.7%. Pickups fell 4.9%. Pedestrians, cyclists, vans, motorcycles, large trucks: all down. SUV deaths rose 1.6%. The only category going the wrong direction.

America Is Removing the Brake Pedal Before It Requires the Brakes to Work
NHTSA proposed eliminating brake pedal requirements for AVs on June 26. The AEB mandate doesn't arrive until September 2029. The regulatory timeline is running backwards.

A $20 Chip Would Have Saved Them: The TikTok Theft Epidemic Hiding in FARS Data
FARS model year data reveals the fingerprint of the Kia Boys epidemic: a 52% death spike for vehicles missing a $20 immobilizer, and an 82% drop the year it was finally added.

America's Safety Streak Hit a Wall in July. The Math Says It Was Always Going To.
NHTSA’s cumulative estimates hide the quarterly math. Q2 2025 dropped deaths 9.9%. Q3 managed 3.2%. The longest safety streak in FARS history is decelerating.

Every Car in America Has the Same Backdoor That Killed Martha Avila
Tesla says the driver overrode Full Self-Driving at 73 mph. But the override isn’t a Tesla problem—it’s an industry design choice built into every AEB-equipped vehicle on the road.

The U.S. Has Two Official Counts of Its Road Dead. They’re 3,535 Bodies Apart.
NHTSA says 39,254 died in 2024. CDC says 42,789. Both are correct. The gap hides parking lot deaths, driveway deaths, and everyone who died on Day 31.

America Has Had Three Great Death Declines. The First Two Ended Badly.
Fifteen consecutive quarters of declining traffic deaths. The last two streaks reversed violently when recessions ended. This one might be different: it’s driven by fleet turnover, not economics.

Three Numbers Define Every Car in America. None of Them Predict Each Other.
Crash frequency, lethality, and impairment rate are three effectively independent axes with an average R-squared of 4.7%. The Cobalt scores worst on all three.

One Engineering Team Controls 17,227 American Deaths
GM’s full-size truck platform accounts for more FARS fatalities than most automakers produce across their entire lineup. Platform sharing concentrates life-and-death decisions in fewer hands than ever.

The 39% Illusion: Your Safety Features Fight the Crashes That Don’t Kill You
HLDI data shows bundled safety tech reduces insurance claims 39%. Cross-referencing with FARS reveals it prevents less than 1% of traffic fatalities. Insurance sees a revolution. The morgue sees a rounding error.

Your Truck’s Crash Survivability Comes at a Price. Pedestrians Are Paying It.
Pickups have the best occupant crash survivability of any vehicle class. A new NYT/IIHS study quantifies the cost: 2.8% more pedestrian deaths per inch of hood height.

IIHS Saved 48,352 Lives. The Vehicles That Failed Its Tests Are Still Killing People.
IIHS crashed a 1996 Blazer into a 2026 Blazer to celebrate 30 years. The dummy’s head came off. But 89.9% of Blazer deaths in FARS involve the old model they just destroyed.

The Jeep Wrangler Tipped Over in Crash Tests for Seven Years. Stellantis Called It ‘Anomalous’ Every Time.
Three IIHS tests. Three tip-overs. Three frame rail redesigns. Even fixed, it only earns ‘acceptable.’ 1.4 million pre-fix Wranglers remain on roads with no recall.

Land Rover’s Fix for 250,857 Potentially Non-Deploying Airbags Is a Dab of Grease. It Was a Dab of Grease in 2016, Too.
JLR recalled a quarter-million SUVs because corroding clockspring connectors might prevent airbag deployment. The fix is lubricant gel. A 2016 NHTSA bulletin shows JLR knew the same connectors corroded a decade ago. The connector was never redesigned.

The UN Just Set the Bar for Self-Driving Cars: ‘As Good as a Competent Human.’ FARS Data Shows That’s Twice as Hard as It Sounds.
The UN’s new AV safety standard demands performance matching a “competent human driver.” FARS data shows one in five fatal-crash drivers is impaired, making the competent-driver bar 28–50% harder than the blended rate every AV company brags about beating.

NHTSA Mandated a Safety System That Prevents 360 Deaths a Year. It Also Causes the Exact Crash It Was Designed to Stop.
Hyundai just recalled 421,078 vehicles for phantom braking. Honda has 3 million under investigation. NHTSA’s AEB mandate includes two false-positive tests the agency admits are “by no means comprehensive.”

73,099 Americans Reported a Defect to NHTSA Last Year. The Agency Investigated 33.
NHTSA’s complaint-to-investigation funnel converts at 0.045%. FY2025 pipeline math: 73,099 complaints in, 522 investigations out, 10.5 million recalled vehicles never repaired.

America’s Cars Have Never Been Older. NHTSA Says We’ve Never Been Safer. Both Can’t Be True.
NHTSA celebrated 2025’s 1.10 fatality rate as second-lowest ever. But 36,640 people died, the fleet averages 12.8 years old, and 82.7% of FARS fatalities involve pre-2015 vehicles.

NHTSA Investigates 100 Crashes a Year. In 2026, It’s Investigated 2.
NHTSA’s Special Crash Investigations program has opened just 2 cases in 2026, a 96% collapse coinciding with DOGE staffing cuts that gutted the agency’s autonomous vehicle safety division.

39,345 Dead and NHTSA Threw a Party
NHTSA celebrated going below 40,000 deaths for the first time since 2020. Nobody mentioned the 23,429 excess deaths above the pre-COVID baseline.

Every State Banned Texting While Driving. 32,717 People Died Anyway.
Cellphone ban effectiveness decays after two years. In 19 states, texting-only bans may actually increase fatal crashes.

Ford Filed 51 Recalls This Year. That Might Make Them the Safest Manufacturer in America.
Ford leads all automakers in recalls because a consent order forces disclosure. FARS data shows the company with fewer recalls kills more drivers per mile.

IIHS Wants to Cut Crash Deaths 30% by 2030. They Need 5.8% Annual Declines. They're Getting 3.8%.
The 30x30 vision requires historically unprecedented sustained declines. The vehicle categories killing the most Americans can't pass IIHS's own tests.

Stellantis Killed the Hybrid to Stop the Fires. The Wrangler Kept Burning.
Four fire recalls in three years across two unrelated ignition pathways. Stellantis killed its entire plug-in hybrid line. Then a million non-hybrid Wranglers needed the same warning: park outside.

NHTSA Killed a Rule That Would Prevent 1,115 Fatal Crashes a Year. Then It Threw a Party.
NHTSA withdrew its own truck speed limiter mandate citing technology that doesn't exist as a mandate. Ten years of delay, 1,115 preventable fatal crashes per year.

America Matched Its Safest Year Ever. 3,896 More People Still Died.
The 2025 fatality rate nearly matched 2014's all-time low. But 3,896 more people died because Americans drove 305 billion more miles.

Every Sedan Driver Drinks the Same. Only Some of Them Die.
Impairment rates are statistically identical across 22 popular sedans. Death rates span 100x. The car is the variable.

America Got Safer in 2024. Unless You’re Over 65.
Traffic deaths fell below 40,000 for the first time since 2020. But fatalities among Americans 65 and older climbed 2%, making seniors the deadliest age group on the road.

Toyota Built the Safest SUV in America. Its EVs Can’t Light a Curve.
The RAV4 posts the lowest fatality rate of any SUV in the FARS database. But every Toyota EV on sale today earned a Poor headlight rating from IIHS, disqualifying all three from safety awards.

Honda Built Its V6 for 27 Years. Then 1.4 Million of Them Started Eating Their Own Bearings.
A crankshaft grinding machine drifted out of spec. Honda denied every post-recall complaint. NHTSA expanded the investigation to 1.41 million of America’s safest family vehicles.

IIHS Finally Graded America’s Work Trucks. More Than Half Flunked a Checklist.
Five of nine heavy-duty trucks and cargo vans failed the first-ever IIHS commercial vehicle safety evaluation. Nobody even had to crash them.

Ford Has Recalled 11.2 Million Vehicles This Year. Now It’s Recalling the Recalls.
Ford accounts for 50% of all U.S. vehicle recalls in 2026. Four of five new NHTSA campaigns last week were re-recalls for repairs it already botched.

Automakers Replaced Your Spare Tire with a Pressurized Bottle. Honda Just Recalled a Million of Them.
Honda recalled 1,049,883 hybrids because the sealant bottle cap can become a projectile. 30 million cars have no spare tire at all.

America Just Had Its Safest Year in a Decade. It’s Still the Deadliest Rich Country on Earth.
Traffic deaths dropped 12% in 2025. A CDC study of 28 nations shows America's best year is still worse than every other rich country's worst.

Nobody Crash-Tests America’s Work Trucks. That’s 6,535 Funerals a Year.
Heavy-duty trucks and cargo vans are exempt from federal crash-test standards. The IIHS just tested them anyway. Five of nine failed.

Ford Recalled Your Car, Fixed It, Filed the Paperwork. The Fix Was Fake.
Ford's dealer diagnostic tool silently reported failed software updates as complete. 318,367 vehicles are being re-recalled. The affected Focus fleet has 1,042 FARS deaths.

Every Brand's Drivers Are Equally Drunk. The Cars Aren't Equally Deadly.
FARS impairment rates vary just 5.4 percentage points across manufacturers. Death rates vary 22.5x. The badge on your hood predicts survival, not sobriety.

America Just Spent Six Years and 24,000 Lives Getting Back to Square One
NHTSA says the 2025 fatality rate matches 2019. The roundtrip cost 23,747 excess deaths. No peer country experienced anything comparable.

Honda Built the Safest SUVs in America. Then Forgot to Rustproof Them.
880,514 Pilots, Passports, Ridgelines, and MDXs recalled for subframe corrosion. FARS shows these are among the safest vehicles on the road. Honda knew about the paint defect for 4.5 years.

2.9 Million Vehicles Recalled in One Week. Here's the Order You Should Actually Fix Them.
Cross-referencing each recalled model against FARS fatality data produces a triage list the press didn't bother to make. The Focus is deadlier per mile than the Wrangler.

Sam Peltzman Said Safe Cars Make Reckless Drivers. Fifty Years of Toxicology Reports Say Otherwise.
Cross-tabulating FARS impairment rates against per-vehicle fatality rates across 198 models reveals zero correlation. Buy the safer car.

Your Recall Was Completed Eight Years Ago. Ford Just Admitted It Wasn't.
Ford recalled 255,404 Focus vehicles marked as “repaired” in 2018 that never received the fix. NHTSA’s recall tracking runs on manufacturer self-reporting it never audits.

The Safest Minivan in America Has Been Recalled for Fire Three Times
The Chrysler Pacifica PHEV scores 0.19 deaths per 100M VMT in FARS. Its LG Energy Solution battery has triggered three fire recalls in four years. Same supplier. Same failure. No root cause.

Your SUV Earned the Highest Safety Award. It Scored ‘Poor’ on the Test That Actually Matters.
The Hyundai Tucson holds IIHS Top Safety Pick+ and a “Poor” whiplash score simultaneously. The award excludes the test that simulates the most common crash type on American roads.

31 States Banned Your Phone. The Wrong Car Kills 12 Times as Many People.
Pennsylvania just started fining drivers $50 for holding their phones. FARS data shows vehicle choice determines survival 12 to 37 times more than hands-free laws ever could.

3.8 Million Vehicles Got Recall Letters This Week. The Deadliest Cars in America Did Not.
NHTSA recalled 3.8 million vehicles in a single week. Their average fatality rate: 0.83 per 100M VMT. The ten deadliest vehicles: 5.32. The recall system catches defects. It ignores design.

880,000 of Honda’s Safest Vehicles Are Rotting From Underneath
Honda recalled 880,514 Pilots, Ridgelines, Passports, and MDXs for corroding rear subframes. FARS says these are among the safest SUVs on the road. FARS can’t see rust.

The 'Ultimate Driving Machine' Is the Ultimate Luxury Sedan Killer
BMW 3 Series drivers die at 4.3x the rate of Mercedes C-Class drivers. Impairment rates are identical. FARS data reveals the deadliest luxury sedan in America.

Stellantis Killed the Hybrid to Stop the Fires. The Gas Models Caught Fire Anyway.
Three fire mechanisms across every powertrain Jeep sells. Over 1.4 million vehicles recalled. One instruction: park outside.

February 2026 Hit 1.01. Half the Country Got Worse.
The U.S. monthly fatality rate just broke the all-time record. But 10 states saw double-digit increases in early 2026. The safest month in history is a story about two countries.

36,640 Dead. The Decline Is Real. Half of It Is Just Old Cars Dying.
Traffic deaths dropped 6.7% in 2025. We decomposed the decline using FARS fleet data. Roughly half the improvement comes from pre-ESC vehicles scrapping out of existence.

1.2 Million Cars Recalled Because Their Gas-Saving Features Catch Fire
Three automakers, three fuel-economy technologies, one outcome: fire. Start-stop systems, ISG pumps, and 48V mild-hybrid generators are burning up.

Three Recalls, One Chemistry Lesson Your Car Failed
Airbag propellants, seatbelt pretensioners, and roof adhesives all share the same fatal flaw: they degrade in heat. 67.5 million vehicles recalled.

One Supplier Has Been Making Roofs That Fly Off for Sixteen Years
Webasto's adhesive bonding defect has persisted across Mercedes, Subaru, and aftermarket installations since 2010. Nearly a million vehicles recalled.

Five Automakers, One Safety Device, None of Them Got It Right
Ford, Kia, Hyundai, Mercedes, and others recalled over a million vehicles for seatbelt defects in 2026. The 67-year-old safety device is now an industry-wide quality crisis.

Every Car Has a Death Invoice. We Calculated Yours.
Using FARS data and DOT’s $12.5M Value of Statistical Life, we computed the societal cost each vehicle model externalizes. The spread is 40:1.

6 of 15 “Safe” Teen Cars Have Above-Average Death Rates. The List Doesn't Mention It.
Cross-referencing the IIHS/CR teen driver list against FARS data reveals a $4,800 crossover upgrade buys a 25x reduction in fatality rate.

The Toyota Land Cruiser Has a Higher Death Rate Than a Mustang. Nobody Talks About It.
FARS data shows the Land Cruiser kills at 6.27 per 100 million miles — the second-deadliest SUV in America. Its drivers aren't even drunk.

2,028 People Killed by “Legal” Drivers Last Year. One State Had the Fix Since 2018.
In 2024, 2,028 people died in crashes where a driver's BAC was between .01 and .07. Utah dropped to .05 in 2018 and cut fatal crashes 19.8%. The NTSB recommended the same thing nationally in 2013. Nobody listened.

NHTSA Tracked Every Robotaxi Crash for Four Years. On June 16, It Stops.
The Standing General Order built the only comprehensive AV crash dataset in existence. The amended version guts reporting triggers, eliminates duplicate filings, and drops follow-up reports.

Subaru Built the Safest Cars in America. In 2026, Half a Million of Them Got Recalled.
Subaru’s 0.43 deaths per 100M VMT makes it the safest major brand in FARS data. Then 530,000 vehicles got recalled for parts falling off, leaking fuel, and corroding brackets.

Your Car Has 14 Explosive Charges Inside It. Ford Just Proved They Expire.
Ford’s third pretensioner recall for 420,000 Expeditions reveals the same propellant chemistry problem that killed 28 Americans via Takata. The bombs in your dashboard are decomposing.

Toyota Built 270,000 Engines That Could Seize at Highway Speed. Then It Fixed the Problem. Then the Fix Failed.
Three recall waves, one defect. The V35A twin-turbo V6 replaced a V8 that made the Tundra the second-safest full-size pickup. Now it’s a $2.7 billion manufacturing failure.

A Natural Disaster Broke a Capacitor. Now 850,000 Hondas Can’t Tell a Child from an Adult.
FMVSS 208 forced automakers to build sensors that suppress airbags for children. A supply chain cascade turned Honda’s sensor into the opposite.

Ford Used the Nuclear Option on a Ball Joint. That Warning Used to Mean “Your Car Contains a Bomb.”
NHTSA's 'do not drive' order was built for Takata airbags. Ford just deployed it for a stud that wasn't pushed in far enough at a factory in Mexico.

7,000 Sham CDL Schools Shut Down. Their Graduates Are Still Driving.
FMCSA removed 7,000+ fraudulent training schools from the registry. One graduate just killed five people on I-95. Nobody revoked the licenses.

Five States Saved 250 Pedestrians. Twenty-Four States Killed More.
The 'largest pedestrian safety improvement in 15 years' is driven by five states. Twenty-four states got worse. The national number is a mirage.

NHTSA Proved Its Safety Rules Saved 860,000 Lives. Now It Has to Find 10 to Kill for Every New One.
Executive Order 14192 mandates a 10-to-1 repeal ratio. NHTSA's own research shows the regulations it must now cull prevented 860,000 deaths and returned $17 for every $1 spent.

202,345 Truck Drivers Are Banned From Driving. Nobody Took Their Keys.
The FMCSA Clearinghouse lists 202,345 prohibited CDL holders. 159,226 never started rehabilitation. FARS data shows 24% of truck drivers in fatal crashes had no valid CDL.

Congress Spent $92 Million Building a Drunk Driving Solution. NHTSA Says It Doesn't Work Yet.
18 years and $91.7 million in federal funds produced zero production vehicles. The false positive math explains why passive alcohol detection may never work at scale.

12.1 Million Vehicles Recalled in One Quarter. The Defect Wasn't Mechanical.
Software and electronics defects are now the #1 vehicle recall category in America. Q1 2026 set an all-time record — and most drivers will never get the fix.

1.5 Million Vehicles Recalled Because Their Dashboards Forgot How to Be Dashboards
Seven manufacturers, five different suppliers, eighteen months, 1.5 million vehicles. The failure mode is identical: the digital instrument cluster goes black while driving. The analog gauge never had this problem.

Tesla Claims FSD Is 10x Safer Than You. Three Statistical Distortions Say Otherwise.
Reuters found 10 of 11 traffic-safety researchers call Tesla’s FSD safety stats misleading. The math is even worse than they reported. Correct for all three distortions and the advantage collapses to ~1.1x.

Hyundai Built a Safety System That Causes Crashes. It Knew for 16 Months. 421,078 Vehicles Just Got the Recall.
The Forward Collision Avoidance system slammed the brakes on empty roads, turning 421K Tucsons into rear-end hazards. Hyundai investigated in January 2025. The recall came in May 2026.

Three Recalls, Three Failure Modes, 527,652 Vehicles. The Airbag Was Supposed to Be the Easy Part.
Honda's bags fire at children. Stellantis's fire too late. GM's fire as shrapnel. All in the same week. FARS says these models account for 18,878 deaths.

850 People Died in Work Zones Last Year. Four Out of Five Weren't Wearing Orange.
FHWA says 850 died in work zone crashes in 2024. Roughly 80% were motorists, not construction workers. The I-81 bus crash that killed 5 happened in one.

America's Two Deadliest Trucks Can't Pass a Crash Test. The Meme Truck Aced It.
The F-150 and Silverado have 18,785 combined FARS deaths. Neither earned a 2026 IIHS safety award. The Cybertruck earned the highest one.

Lucid Has Recalled 2,039 Cars for Losing Power Without Warning. This Is the Third Time.
Three recalls, three different failure mechanisms, one outcome: 4,500-pound sedans losing all drive power at highway speed. The inverter keeps finding new ways to quit.

Stellantis Built an Airbag Controller That Holds Grudges. 419,000 Grand Cherokees Have One.
A software bug in the Occupant Restraint Controller permanently remembers sensor faults, even after repair. Side airbags may deploy late. Stellantis knew for 39 months.

30 Years Ago, Airbags Killed Children. The Fix Was One Sensor. Honda Just Recalled 99,000 of Them.
The passenger seat weight sensor was the entire regulatory answer to a child-death crisis. In 98,892 Hondas, it cracks and short-circuits, telling the airbag every passenger is an adult.

The Government Mandated a Braking System That Prevents 24,000 Injuries a Year. It Also Causes Crashes in 4 Million Cars.
AEB prevents rear-end collisions. AEB also causes rear-end collisions. Across five manufacturers, phantom braking recalls and investigations now cover 4+ million vehicles.

Rivian Recalled 20,000 Trucks for a Suspension Defect Its Own Technicians Created. Now 115,000 Are Under Investigation.
NHTSA opened a probe covering nearly every R1 ever built after rear toe links separated at highway speed. Five months ago, Rivian blamed a service procedure. The feds think the problem might be bigger.

1.2 Million Ram Trucks Got Their Recall Fix. The Trucks Still Roll Away.
NHTSA is investigating Ram trucks repaired under two separate recalls for a shifter defect that still lets them shift out of Park without a foot on the brake. The recall system tracks whether you showed up. It does not track whether the fix worked.

One Cop’s Ram 1500 Got 547 Speed Camera Tickets. New York Just Made a Law About It.
NYPD officer James Giovansanti averaged a speed camera violation every 2.7 days for four years. New York responded with the first US law mandating speed limiters on private vehicles. 14,600 drivers qualify.

IIHS Gave Parents a Teen-Safe Car List. The Deadliest ‘Good Choice’ Is 66% More Lethal Than the Safest.
IIHS released its 2026 teen-safe vehicle list with 45 used cars. We ran every model through FARS fatal crash data. The deadliest sedan is 66% more lethal than the safest SUV. Both carry the same safety label.

4.4 Million Vehicles Have a Safety Feature That Causes the Exact Crash It Was Designed to Prevent
Hyundai, Honda, Tesla, and Nissan have collectively put 4.4 million vehicles under recall or federal investigation for phantom braking. NHTSA just mandated this technology for every new car by 2029.

The Safest Midsize Truck on American Roads Just Got the Worst Crash Test Score
Honda's Ridgeline has a 0.24 fatality rate per 100M VMT — lowest of any midsize pickup by 12x. Then IIHS gave it three Poor ratings. Both are correct.

For Every Person a Ram 2500 Kills, 4 of Them Are in the Other Car
FARS data reveals the metric nobody publishes: the occupant death ratio. For a Ram 2500, 80% of fatal crash deaths are outside the truck. For a Cavalier, 86% are inside it.

NHTSA Says 3,208 People Died From Distracted Driving. The Real Number Is Closer to 10,000.
NHTSA counts 3,208 distracted driving deaths. The NSC estimates 24% of all crashes involve phones. The gap exists because we never built a breathalyzer for inattention.

A $100 Device Prevents 67% of Repeat Drunk Driving. 80% of Offenders Never Install It.
Ignition interlocks cut alcohol-impaired fatal crashes by 26% where enforced. The GAO found only 15-20% of convicted DUI offenders actually install one. The compliance gap costs roughly 2,400 lives per year.

NHTSA Can Force Recalls. After 997 in 2025, It Used That Power Exactly Once.
NHTSA issued its first mandatory recall order in decades for 12 aftermarket Chinese airbag inflators. Meanwhile, ARC Automotive's 52 million domestic inflators remain unrecalled after 32 months of procedural delay.

Ram Trucks Were Recalled Twice for the Same Rollaway Defect. The Fix Didn't Fix It.
1.66 million Ram trucks recalled across two campaigns for a brake interlock pin that lets the transmission shift out of Park. Post-repair complaints kept coming. Eight years later, NHTSA is finally asking whether the remedy works.

We Solved Child Car Seat Safety Decades Ago. 70% of Kids in Fatal Crashes Still Aren't Properly Restrained.
50,000 children in FARS data. 70% had suboptimal restraint use. 36% were prematurely graduated to a less protective seat. The technology works. Nobody's using it right.

550 Federal Employees Guard 39,000 Annual Traffic Deaths. The Man Who Cut Their Ranks Has the Most Open Investigations.
NHTSA lost 30% of its workforce to DOGE cuts. The AV safety team went from 7 to 4 investigators. The person who directed the cuts runs the company with the most open NHTSA probes.

Your Car Knows You Crashed. It Won’t Call 911 Unless You Pay.
NHTSA says automatic crash notification could save 700+ lives a year. Most automakers charge $100+ annually to keep it on. The EU made it free in 2018.

Congress Ordered NHTSA to Stop Hot Car Deaths in 2021. The Rule Is 2.5 Years Late. Three Children Died Last Week.
Three children died in hot cars in a single day last week. Congress mandated in-cabin detection in 2021. NHTSA missed the deadline by 2.5 years. The compound cost of that delay is simple and ugly.

NHTSA Used Its Most Powerful Enforcement Tool for the First Time in 20 Years. It Can't Find the Cars.
Counterfeit Chinese airbag inflators killed 10 people in otherwise survivable crashes. NHTSA ordered a recall it admits cannot be executed.

The Agency Protecting 280 Million Drivers Spends $0.13 Per Vehicle Per Year Finding Defects. Congress Wants to Spend Less.
NHTSA's defect investigation office misses deadlines on 94% of its probes. The average investigation takes 617 days. Congress is cutting the budget anyway.

The Backup Camera Mandate Took 16 Years and a Dead Toddler. It Cut Child Deaths by 78%. AEB Is Next.
The AAP proved backup cameras saved children. GM proved AEB cuts crashes by 57%. The federal AEB mandate is frozen. NHTSA says 360 people die every year it's delayed.

The Model Y Is the Safest Car in America and the Subject of the Largest Safety Investigation in History. Both Are True.
FARS gives the Model Y the lowest fatality rate of 337 vehicles. NHTSA just gave it the first-ever ADAS safety award. NHTSA is also investigating 3.2 million Teslas for FSD crashes. All three are simultaneously correct.

600,000 Trips Exposed a Trendline Nobody Expected: The Faster You Drive, the More You’re on Your Phone
IIHS telematics data from 600,000 trips shows phone handling rises 12% for every 5 mph over the speed limit on highways. Speed and distraction aren’t separate problems. They’re the same drivers.

Hyundai Won More Safety Awards Than Any Automaker in 2026. It Also Has 475,000 Vehicles Under Recall.
Hyundai earned 7 IIHS safety honors this year while recalling 475,000 vehicles for phantom braking and fire risk. Both facts are true. The gap between them reveals two safety systems measuring completely different things.
421,000 Hyundais Just Got Recalled Because Their Safety System Keeps Slamming the Brakes for No Reason
Hyundai, Honda, and Freightliner all have the same problem: AEB that fires when nothing is there. NHTSA's mandate math has a denominator problem nobody counted.

The NSC Just Published Its Memorial Day Body Count Forecast. It’s 393.
The National Safety Council predicts 393 Americans will die on the road this weekend. Thirty-six years of FARS data tell us exactly who, where, and why.

NHTSA Stamped ‘100% Defect Rate’ on Waymo. It Accidentally Proved Software Recalls Are Better.
Waymo recalled 3,791 robotaxis and fixed them in hours via OTA. The average hardware recall completion rate is 45%. More than 17 million recalled vehicles will never be repaired. The recall system is the defect.

Uber Sold Its Self-Driving Division, Then Outsourced the Crashes
Avride's robotaxis crashed 16 times in four months across Dallas and Austin. Safety monitors were in every car. They intervened once. NHTSA opened a probe. Uber declined to comment.

FARS Changed How It Counts Drugs in 2018. The 'Epidemic' Didn't Spike. The Spreadsheet Did.
Columbia University analyzed 138,505 dead drivers and found the post-2018 drugged driving surge is largely a measurement artifact. FARS expanded its drug fields and the numbers jumped 42%. Alcohol, counted correctly all along, barely moved.

Your Back Seat Is Stuck in 1996. IIHS Just Proved It by Failing the Corolla.
For 30 years, crash tests ignored the rear seat. Now that IIHS finally put a dummy back there, the Toyota Corolla, Honda Ridgeline, and BMW 3 Series all failed. The back seat didn't get worse. The front seat just left it behind.

12 Automakers Replaced Your Gauges With a Screen. Two Million of Those Screens Have Been Recalled.
The auto industry traded 20 independent analog gauges for one digital display. When it fails, you lose everything. It's failing at industrial scale.

We Called the Ridgeline the Safest Pickup in America. Then IIHS Crashed One.
The Honda Ridgeline has the lowest FARS death rate of any midsize pickup at 0.24 per 100M VMT. On May 19, IIHS gave it a Poor rating. Both are true. Neither is lying.

The Safest Car in Your Driveway Isn't the One Your Teen Is Driving.
JAMA data shows 27.6% of teen drivers killed were in cars over 15 years old. Those vehicles carry a 31% fatality premium and almost no crash-avoidance tech. Parents can fix this today.

Fentanyl Went from 1 in 4 DUI Labs to 9 in 10 in Eight Years. There Is No Roadside Test.
In 2016, 26% of forensic toxicology labs reported fentanyl among their top DUI drugs. By 2024, that number hit 89%. The opioid epidemic and the traffic death epidemic share a toxicology report.

NHTSA Used Its Nuclear Option for the First Time in 20 Years. It Can't Find a Single Car to Fix.
997 recalls a year are voluntary. NHTSA just forced its first mandated order in decades against Chinese DTN airbag inflators. The manufacturer denies selling in the US. There's no list of affected vehicles.

60% of Drivers Fear Headlight Glare. It Shows Up in 0.1% of Crash Reports.
AAA says 60% of drivers fear glare. IIHS crash data says it causes 0.1% of nighttime crashes. America is afraid of the wrong thing after dark.

Your Car’s AEB Sees Pedestrians. Cyclists Are Invisible.
FMVSS 127 mandates automatic emergency braking for pedestrians by 2029 but explicitly excludes cyclists. 1,166 dead in 2023. The EU fixed this three years ago.

12 Million Recalls. Fewer Deaths. The Safety Floor Nobody Talks About.
Q1 2026 saw 12.1 million vehicle recalls, the highest quarterly total in years. Traffic deaths hit a six-year low. Both things are true, and only one of them matters.

Congress Spent 12 Years Mandating Backup Cameras. 7 Million of Them Don’t Work.
NHTSA estimated backup cameras would save 58–69 lives per year. By 2026, 7 million vehicles have unfixed camera recalls. The mandate assumed the cameras would work. Nobody planned for when they don’t.

16 Robot Crashes Got a Federal Investigation. 13,000 Human Deaths Got a Press Release.
NHTSA launched a formal probe after 16 Avride robotaxi crashes killed nobody. In the same four months, human drivers killed 13,000 people and nobody opened a file.

Every Other Muscle Car Got Safer. Dodge Chose Horsepower.
FARS data reveals the Challenger is the only one of America’s Big Three muscle cars where newer model years are deadlier. Camaro and Mustang redesigns saved lives. Dodge stacked 600 extra horsepower on a 15-year-old platform instead.

NHTSA’s Newest Mandate Will Save 50 Lives a Year. That’s a Rounding Error.
NHTSA mandated rear-seat seatbelt alarms for 2027 vehicles. Their own cost-benefit analysis says it will save 50 lives per year out of 9,758 unbuckled deaths. That is 0.5 percent of the problem.

For Every Dollar NHTSA Spends Saying ‘Slow Down,’ Carmakers Spend $540 Saying ‘Go Fast’
IIHS found 43% of car ads glorify speed while only 3% mention safety. The industry spends $5.2 billion per year marketing the behavior that kills 12,000 Americans annually.

JLR Recalled 170,000 Vehicles Because a Single Chip Failure Kills Power and Lights Simultaneously
A DC-DC converter defect in JLR's 48V mild hybrid system creates a sudden dual cascade: total loss of propulsion and exterior lighting. No fix exists yet. And every automaker is adopting the same architecture.

America's Traffic Death Rate Just Hit a Record Low. It's the Same Number From 2014.
The 2025 fatality rate of 1.10 per 100M VMT is being celebrated as historic progress. In 2014, it was 1.08. A decade of safety mandates bought the country two hundredths of a point.

NHTSA Used Its Recall Power for the First Time in 20 Years. The Target Couldn't Fight Back.
NHTSA's first forced recall in decades targeted a Chinese airbag inflator maker with no US lawyers, no lobbyists, and no ability to resist. GM and Takata killed hundreds and never faced the same authority.

Ford BlueCruise Killed 3 People and Recorded Zero Data Points
The NTSB found Ford's hands-free driving system can't see stopped cars at highway speed. When it crashes, it records nothing. The regulatory gap covers 2.5 million vehicles.

43% of Car Ads Sell Speed. 3% Mention Safety. 11,288 People Died.
IIHS found automakers tripled speed advertising while cutting safety messaging by 73 percent. The death toll didn't budge.

For 48 Years, NHTSA Rated Cars on How Well They Crumpled. One Car Finally Passed the Other Test.
NHTSA spent 48 years rating cars on crumple zones. In 2026, they finally tested whether cars try not to crash. One car passed.

47% of Q1 Recalls Were Electrical. The System Was Built for Brake Lines.
12.1 million vehicles recalled in Q1 2026. Nearly half for electrical defects. Half fixable by wireless patch. The verification framework hasn’t changed since 1966.

NYC Put Speed Governors on 700 Cars; Speeding Dropped 64%; Nobody Sells Them
A $200 device cut speeding by 64% in NYC fleet vehicles. NHTSA says speed kills 12,000 per year. 64% of 12,000 is 7,600. No US automaker installs it.

NHTSA Ran 997 Recalls in 2025. It Ordered Exactly One. The Manufacturer Doesn’t Exist.
The US vehicle recall system depends almost entirely on voluntary compliance. Of 997 recalls in 2025, 88% were self-initiated by manufacturers. The first compulsory order in decades targeted a Chinese company that can’t be reached.

GM Says Its Safety Tech Prevents 86% of Crashes. The Math Saves 3%.
Cross-referencing GM-UMTRI's ADAS effectiveness data against FARS fatal crash type distributions reveals the 86% headline applies to one of the rarest causes of traffic death.

Your CR-V Can See 28% of What’s in Front of It. Its Death Rate Is 0.53. Those Numbers Are Connected.
IIHS blind zone data crossed with FARS occupant fatality rates reveals an inverse relationship: the safest SUVs for occupants lost the most forward visibility over 25 years, creating the deadliest vehicles for pedestrians.

1 in 5 Impaired Drivers Who Die in Crashes Are on Alcohol AND Drugs. The Breathalyzer Catches Half.
FARS toxicology data: 18,336 dead drivers tested positive for both alcohol and drugs. Polysubstance impairment grew 38% in four years. America has 10,000 cops trained to detect it.

Zero Minivans Earned a Safety Award in 2026. The Back Seat Is the Reason.
IIHS raised the bar for 2026 and every minivan failed. The irony: the vehicle designed to haul your kids can’t protect the seat they’re sitting in.

Your Car Was Crash-Tested With a Man’s Body. 8,600 Women Paid for That With Their Lives.
Federal crash tests used a 170-lb male dummy for decades. A PMC study found women face 20% higher fatality risk in comparable crashes. FARS data implies roughly 8,600 excess female vehicle occupant deaths from 2014 to 2023.

Ford Just Recalled 1.4 Million F-150s for a Defect That Slams You From 6th Gear to 2nd at Highway Speed
A worn sensor tells the computer you shifted when you didn’t. At 70 mph, the transmission drops four gears. The rear wheels lock. The F-150 already has 9,194 deaths in FARS.

Your Ram 2500 Is in a Fatal Crash. 80% of the Time, You Walk Away.
FARS data reveals a hidden trade balance in America’s crash ecosystem: heavy trucks export death to lighter vehicles at a 4-to-1 ratio.

The U.S. Death Rate Hit 1.10. For 23 Million Vehicles, It’s Still 2.75.
Cross-tabulating FARS per-model fatality rates against fleet share reveals that America’s 1.10 death rate is a weighted average of three statistically distinct vehicle populations, with a 6.9× gap between them.

Ford Issued 153 Recalls Last Year. 98% of Their Death Toll Can’t Receive One.
FARS data reveals that 98.4% of Ford’s fatal crash deaths involve pre-2020 vehicles unreachable by OTA software fixes, even as Ford touts 80% of its 2026 recalls as over-the-air updates.

The Junkyard Dividend: America’s ‘Safest Year’ on the Road Is Really About Scrapping Death Traps
NHTSA says 2025 was the safest year since 2019. FARS data says the real hero is the scrapyard: 65% of fatal-crash vehicles are pre-2010 models now rusting into oblivion.

1 in 4 Impaired Fatal Crash Drivers Would Pass a Breathalyzer
24,160 fatal crash drivers tested positive for drugs but not alcohol over a decade. Every sobriety checkpoint in America would have waved them through.

NHTSA Just Built a Safety Test for Cars That Don’t Need It
NHTSA’s brand-new ADAS safety benchmark tests vehicles that already have the lowest death rates in America. 92% of fatal crashes involve vehicles too old to ever take it.

The Sedan Extinction Dividend: America’s SUV Addiction Is Accidentally Saving 5,000 Lives a Year
FARS data reveals sedans die at 2.5× the rate of SUVs per mile driven. As America abandons sedans, the death toll drops by thousands annually. Nobody planned this.

42 Truck Vintages Account for 10% of Every Road Death in America
Just 1% of all make-model-year combinations in the FARS database produce 10.4% of all traffic deaths. 26 of the 42 are Silverados or F-150s built before 2009.

72% of America’s Road Deaths Happen in Vehicles That Pre-Date Stability Control
134,491 people died in vehicles built before electronic stability control was federally required. For pickups, the pre-ESC share hits 82%.
Same Truck, Different Body Count: The Silverado Kills 24% More Per Mile Than the Sierra
FARS data reveals the Chevrolet Silverado has a 24% higher fatality rate than the mechanically identical GMC Sierra. The badge doesn’t change the truck. It changes who dies in it.

Mitsubishi Filed Zero Recalls in 2024. The Montero Kills at Nearly Twice the F-150’s Rate.
Mitsubishi has filed 150 total recalls in 40 years. Ford did 153 in 2025 alone. Cross-reference with FARS fatality data and a brand hiding behind low sales volume starts to look dangerous.

96% of Fatal Solara Crashes Involved Sober Drivers. The Camry’s Number Is 81%.
The Toyota Solara has the lowest impairment rate in the FARS database and a death rate more than double the Camry's. Same platform, same factory, 2x the body count.

There's No Blood Test for Exhaustion. That's Why 5,693 Deaths Disappear Every Year.
FARS records 633 drowsy driving deaths. The GHSA estimates the real number is 6,326. The gap exists because fatigue leaves no toxicology marker.

NHTSA Opened Three Investigations Into 4.3 Million Vehicles. The Defects Explain 0.77% of Their Deaths.
Three active federal defect investigations cover 4.3 million vehicles and 39,053 FARS deaths. The defects under investigation might explain roughly 300 of them.

63 Vehicles Won IIHS Awards. America's Best-Selling Trucks Weren't Among Them.
Cross-referencing 2026 IIHS awards against a decade of FARS data reveals a 4.7x death rate gap between award winners and the trucks Americans actually buy. Zero minivans qualified.

Traffic Deaths Dropped 6.7%. Thank the Scrapyard, Not the Senate.
62.3% of all FARS fatalities involve vehicles from 2008 or earlier. As pre-ESC cars get scrapped, deaths fall mechanically. The 2025 decline is about physics and rust, not policy.

9% of Drivers Skip the Seat Belt. They Account for Half the Dead.
Only 8.8% of American drivers are unbuckled. They generate 49.2% of all passenger vehicle occupant fatalities. That concentration ratio of 5.5× is more extreme than any vehicle design defect.

Congress Is Fighting a ‘Kill Switch’ That Doesn’t Exist. The 44,000 Dead Since 2021 Are Real.
The HALT Act mandated alcohol detection tech in all new cars. NHTSA missed its deadline. Congress wants to defund it. 44,000 people died in alcohol-impaired crashes while everyone argued about a technology that doesn't exist yet.

Your Car's Emergency Braking Was Tested at Parking Lot Speeds. It Fails at Highway Speeds.
IIHS certifies AEB at 12-25 mph. Only 3% of rear-end crashes happen that slowly. AAA tested 2024 models at 55 mph. None stopped in time. The federal rule that would fix this is frozen.

NHTSA Tracks 29 Million VINs a Year. It Can't Track a Single Aftermarket Airbag.
Chinese-made DTN airbag inflators killed 10 people in otherwise survivable crashes. NHTSA's entire recall system is VIN-based. Aftermarket parts don't have VINs.

Ford Recalled 180,000 Trucks Because the Seat Might Come Off
179,698 Rangers and Broncos recalled for a loose seat bolt. The Ranger already kills at 2.91 per 100M VMT. About 43,000 of these trucks will probably never get fixed.

NHTSA Just Spent $665 Million Fighting 20% of the Problem
$665M in grants for DUI checkpoints and seatbelt campaigns. Meanwhile, 80% of fatal crash drivers were sober, and model year improvements cut fatalities by 84%. The math doesn't add up.

The Pandemic Is Over. The Pandemic Driving Isn't.
NHTSA celebrated 39,345 deaths as progress. At pre-COVID rates, 2,295 fewer people would have died. Five years of behavioral drift have killed roughly 27,600 Americans nobody is counting.

Your Car Has a Lethality Index. The Cavalier's Is 86%.
We ranked 337 vehicles by how often their occupants die when involved in a fatal crash. Cheap sedans top 85%. Heavy trucks bottom out at 21%. The spread is 4-to-1.

The 2014 Ghost: Why the Safest Year in Driving History Was 11 Years Ago
In 2014, the U.S. hit 1.08 deaths per 100M VMT. After 11 years of AEB, lane keeping, and backup cameras, we still haven't matched it. 676 people per year die in the gap.

Faster Drivers Use Their Phones More, Not Less
IIHS analysis of 600,000 trips finds phone handling rises 12% for every 5 mph over the speed limit. Cross-referenced with FARS sober-driver data, the fastest drivers are the most distracted.

Ford Sells a Vehicle 43 Times Deadlier Than Another Ford
Within-make fatality rate spreads reach 43x. Brand loyalty is meaningless for safety. The choice within a brand dwarfs the choice between brands.

The Nissan NV200 Is the Only Vehicle Where Drugs Outrank Alcohol in Fatal Crashes
FARS toxicology data for 307 vehicle models reveals the drug-to-alcohol ratio varies by nearly 4x. Commercial delivery vans are drug-shifted. European luxury cars are alcohol-dominated.

Pontiac Stopped Making Cars in 2010. It Still Killed 3,038 People.
FARS data reveals defunct brands Pontiac, Mercury, Saturn, and Oldsmobile collectively killed 5,818 people between 2014 and 2023. More than BMW, Subaru, or Volkswagen.

Nearly 1 in 3 Pedestrians Killed in America Were Legally Drunk. We Keep Redesigning the Cars.
FARS data shows 30% of pedestrians killed in fatal crashes had a BAC at or above .08. Pedestrian intoxication is nearly double the driver intoxication rate. The safety industry focuses almost exclusively on vehicle design.

Non-Pedestrian Deaths Fell 10% in 23 Years. Pedestrian Deaths Rose 54%. The Fix Has Never Been on the Road.
A new FAU study finds that U.S. pedestrian deaths are driven by land-use decisions, not road design. At UK rates, 5,488 Americans killed each year walking to arterial-sited destinations would still be alive.

NHTSA Celebrates a 7.6% Decline in Fatality Rates. A Single Vehicle Swap Delivers 90%.
One trip to a Toyota dealership eliminates more fatal crash risk than 30 years of national safety progress at the current rate of improvement. We ran the math on four same-brand swaps.

FARS Says the Range Rover Sport Is Nearly the Safest Crash You Can Have. NHTSA Says Its Steering Can Snap Off.
The vehicle with the second-lowest lethality ratio in our 337-model FARS dataset is under federal investigation for catastrophic steering failure. 331,559 vehicles. 522 documented knuckle cracks. FARS can’t see any of them.

Traffic Deaths Fell 11% in Two Years. Truck Crash Injuries Rose 12%. That’s Not a Contradiction.
FARS data reveals the mechanism behind simultaneous declining deaths and rising injuries: the fleet shift toward SUVs and pickups is converting fatalities into injuries, not preventing crashes.

NHTSA Says Roads Are the Safest in a Decade. Your Car Might Disagree by 71x.
NHTSA's celebrated 1.10 fatality rate hides a 71-fold spread between the safest and deadliest vehicles on the road. The national average tells you nothing about your risk.

I Ranked Every Brand by Generational Safety Gains. Kia Finished Last.
FARS model-year data reveals 15 of 16 major automakers cut deaths between vehicle generations. Kia's nearly doubled. The explanation is more interesting than the headline.

Truck Drivers All Drink the Same. The Truck Decides Who Dies.
FARS toxicology data shows pickup truck impairment rates vary just 1.6x across all models. Death rates vary 37x. The vehicle is the variable, not the driver.

36,640 Dead Is Not Progress. It's a Floor.
NHTSA says 2025 road deaths hit a 6-year low. FARS data says the fleet got dramatically safer while the body count barely moved. Something is eating the engineering gains.

Your Airbag Might Be a Grenade. NHTSA Found 10 Dead Drivers to Prove It.
Counterfeit Chinese airbag inflators have killed 10 drivers in survivable crashes. FARS data reveals why the Malibu and Sonata were targeted.

More Than Half of Pickup Truck Deaths Come From Trucks Old Enough to Vote
FARS cross-tabulation reveals 54% of pickup truck fatalities come from pre-2005 models. Pickups stay on the road 47% longer than sedans, and they keep killing the entire time.

4.3 Million Cars Too Dangerous for Your Garage
NHTSA has told 4.3M+ vehicle owners to park outside due to fire risk. We cross-referenced them with a decade of crash fatality data. The road kills more than the garage.

IIHS Gave Out 63 Awards. The Vehicles Killing You Didn't Qualify.
SUVs captured 74.6% of 2026 IIHS safety awards. FARS data shows they have the lowest fatality rate. For the first time, ratings and reality converge.

The F-150 Was Present at 20,066 Fatal Crashes. Its Driver Walked Away from Most of Them.
No single nameplate appears in more fatal crashes than the Ford F-150. Its occupants die less than half the time. The asymmetry is the engineering working as intended.

45,540 Americans Died Because We Couldn’t Hold a Rate We Already Hit
NHTSA celebrates 2025’s “record low” traffic deaths. But since 2014, 45,540 excess fatalities have accumulated because the U.S. never maintained its own best safety rate of 1.08 deaths per 100M VMT.

America’s Biggest Safety Initiative Just Targeted the Wrong Variable
NHTSA’s Pathways to Safer Streets focuses on driver behavior, but FARS data shows impairment holds constant at ~20% across all vehicle models while death rates vary 284-fold. The initiative addresses the constant and ignores the variable.

Your Vehicle Class Doesn’t Predict Your Crash Survival. Your Model Does.
Within-class crash lethality variance is 2.25x between-class variance in FARS data. 42 sedans beat the worst SUVs. The badge on your tailgate is not a safety rating.

America’s Death Rate Is 1.10. The Cars Say It Should Be 0.75.
The 2025 fleet is radically safer than 2014’s. The death rate barely budged. Something is consuming the engineering dividend, and it fits in your pocket.

Opioid Deaths Dropped 26%. Traffic Deaths Dropped 6.7%. Nobody Connected Them.
CDC reports the largest overdose decline ever recorded. NHTSA reports the lowest traffic death rate in decades. FARS toxicology data suggests the two trends share a common variable nobody is talking about.

Every Car Under $20,000 Is Dead. The Replacements Are Deadlier.
Nine sub-$20K cars have been discontinued since 2020, leaving 3,213 FARS deaths in the rearview. Budget buyers now face older used vehicles with fatality rates 2-3× worse.

Every Luxury SUV on the Road Kills More People Outside It Than Inside It
The Audi Q7’s “weapon score” is 2.17: for every occupant who dies, 2.17 other people die instead. The Chevy Cavalier scores 0.17. That’s a 12.8× asymmetry.

The Honda Odyssey Has the Soberest Drivers in Its Class. It Crashes Twice as Often as the Sienna.
864 deaths. Lowest impairment rate among minivans at 15.4%. Yet the Odyssey crashes at 2.24× the rate of the Toyota Sienna, whose drivers are 23% more likely to be impaired.

The Dodge Grand Caravan Killed 1,782 Americans. It Was Supposed to Be the Safe Choice.
FARS data reveals a 7× death rate gap within the minivan category. The Grand Caravan posted 1.33 deaths per 100M VMT. Its replacement, the Chrysler Pacifica, posts 0.19.

Kia Is Statistically the Safest Brand in America. Nobody Noticed.
FARS data across a decade shows Kia’s brand-average fatality percentile is 11.2%. Toyota’s is 48.1%. The budget brand is the safety brand.

31 Cars Almost Never Kill Their Occupants. You Can Buy 28 of Them Today.
A cluster of 31 vehicles in the FARS database have near-zero occupant death rates. The engineering is solved. The information gap isn’t.

BMW’s Safest Car Beats Every Volvo. BMW’s Deadliest Is 30 Times Worse.
FARS data shows Volvo’s death rate spread across all models is just 2.6×. BMW’s is 30×. The safest brand isn’t about having the best car. It’s about never selling a dangerous one.

They Survived the Crash. The Door Handle Needed a User Manual.
At least 15 people have died in Tesla crashes where electronic door handles failed. The problem spans 13 automakers. Congress is trying to fix a door.

NHTSA Closed the Parking Lot Robot Investigation. It Escalated the Highway One.
159 parking lot bumps, zero deaths: case closed. 9 highway crashes, one death: investigation upgraded. FARS shows what FSD is actually up against.

225,000 Stellantis Vehicles Were Already Killing People. Now They Have Bombs in the Steering Wheel.
Stellantis says don’t drive these cars. FARS says 4,071 people in those exact model years are already dead. The airbag fix is free. 225,000 owners haven’t done it.

The Jeep Liberty’s Gas Tank Was Behind the Axle. Chrysler’s Fix Was a Trailer Hitch.
FARS records 801 deaths in the 2002–2007 Jeep Liberty. The fuel tank sat behind the rear axle with no shield. Chrysler refused a recall, then offered a trailer hitch as a crash barrier. Only 12% of owners ever got even that.

America’s DUI Body Count Belongs to the Walmart Parking Lot
The top five DUI-fatality vehicles in FARS are the Silverado, F-150, Accord, Camry, and Civic. Five appliances producing 4.6 impaired fatal crashes per day. None has an impairment rate above the class average.

The $14,730 Question: How Much Crash Survival Can You Actually Buy?
The Nissan Versa was America’s cheapest new car. FARS data shows its occupants die 72.3% of the time in fatal crashes. Budget subcompacts as a class run 71–75% lethality vs 39–56% for midsize vehicles.

You’re Already in a Fatal Crash. Here Are Your Odds.
FARS data reveals the conditional survival rate for vehicle occupants in fatal crashes varies from 8% to 80% depending on what you drive. A Ram 2500 occupant survives 79.5% of fatal crashes. A Saturn S Series occupant survives 7.6%.

Crash Frequency Explains 3% of Whether You’ll Die
Pearson r = 0.18 across 272 FARS vehicle models. How often a car crashes and how often it kills are nearly independent dimensions. Traditional death rates conflate two unrelated risks.

A Single Number Exposes America’s Most Lethal Used Cars
Multiplying crash frequency by lethality produces a composite Danger Score. The Chevy S-10 scores 652. The Tesla Model 3 scores 6. A 100-to-1 spread nobody publishes.

America’s Death Rate Hit a Historic Low. The Cars Doing the Killing Didn’t Get the Memo.
1.01 deaths per 100M VMT. Historic low. Except 90 models still kill above that rate and produce 69% of all fatalities. The average is a fleet-composition illusion.

ESC Saved Truck Drivers. It Barely Dented the SUV Body Count.
Electronic stability control cut pickup deaths 43% and van deaths 44%. SUVs? Down 5.5%. Sports cars got 8% worse. Fleet growth ate the safety dividend.

The Mini Cooper Has Go-Kart Handling. It Also Has Go-Kart Crumple Zones.
FARS data shows the Mini Cooper has a per-crash lethality of 0.653, higher than every crossover SUV in the database. Its drivers are among the soberest in fatal crashes. The problem is 2,700 pounds of physics.

The Ford Fiesta Survived Crashes Better Than the Average SUV. Nobody Noticed.
A 2,500-pound subcompact posted per-crash lethality of 0.473, lower than the average SUV at 0.516. Engineering beats mass.

Three Agencies Can’t Agree on What the Kia Soul Is. FARS Data Settles It.
NHTSA calls it an SUV. IIHS calls it a small car. FARS classifies it as a sedan. Per-crash lethality of 0.643 is within 0.002 of the sedan class average and 22.7% worse than real SUVs.

For Every Death on American Roads, 62 People Are Injured. That Ratio Is Climbing.
NHTSA’s 2024 data shows 39,254 killed and 2.42 million injured. Deaths dropped 6.7% in 2025. Injuries didn’t. The gap reveals America is surviving crashes better, not avoiding them.

Same Brand, Same Price, 10x the Death Rate
FARS data exposes a brutal gap between sedans and crossovers from the same manufacturer. The Toyota Camry’s death rate is 968% higher than the RAV4’s. Every sedan lost.

Your Car’s Safety Rating Is Hiding a Second Number
Nissan Kicks, Honda Fit, and Hyundai Accent post low fatality rates per VMT. But when they crash fatally, their occupants die over 70% of the time. The rate flatters them. The physics don’t.

Same Price, Same Stars, Different Odds of Walking Away
FARS lethality rankings reveal 16–29% survival gaps between direct competitors with identical IIHS ratings. The Honda Accord is the deadliest midsize sedan. The VW Jetta is the safest compact.

Minivans Are Exactly As Safe As SUVs and America Chose the Expensive One
FARS class averages: vans 0.626, SUVs 0.630 deaths per 100M VMT. The Chrysler Pacifica matches the RAV4. The Sienna beats the Explorer. The safety argument for ditching minivans doesn’t exist.

Zero Out of Five: The Back Seat of America’s Best-Selling Small Cars Is a Death Trap
IIHS tested five small cars with a rear-seat dummy for the first time. All five failed. Honda Civic, Toyota Corolla, Nissan Sentra, Kia Forte, Subaru Crosstrek. 14,069 combined deaths in FARS.

36,640: America's Record Low Is a Retirement Party, Not a Revolution
NHTSA's record-low traffic deaths in 2025 are real. But FARS data suggests the improvement is driven by fleet attrition of the deadliest vehicle generation, not a behavioral breakthrough.

29% of the Fleet Produces 63% of the Deaths
A fleet-weighted FARS analysis reveals that less than a third of America's registered vehicles produce nearly two-thirds of all traffic fatalities.

Hyundai Wins Every Safety Award. FARS Says It Barely Matters.
A brand-level FARS analysis reveals Hyundai cut model-year fatalities just 6% while Ford and Chevy dropped 76%. Awards and actual deaths tell different stories.

12 Million Recalls Didn't Save Anyone. Buying SUVs Did.
Traffic deaths fell 6.7% in 2025. FARS data reveals the real driver: Americans accidentally replaced high-lethality sedans with lower-lethality SUVs. Recalls had nothing to do with it.

Honda Cut Fatal Crashes in Half. Hyundai Tripled Theirs.
FARS model-year data across 62 vehicles reveals a hidden safety improvement gap: most automakers cut fatal crash deaths 50-90% between 2000s and 2010s models. Hyundai and Nissan went the other way.

Ford Issued 153 Recalls in One Year. None of Them Fixed What Actually Kills People.
Ford set the all-time recall record in 2025. Cross-referencing those 153 recalls with FARS fatality data reveals zero overlap between what Ford is fixing and what is killing Ford drivers.

1.9 Million Vehicles Just Lost the Safety Feature That Saves 78% of Backover Victims
Ford and Toyota recalled nearly 1.9 million SUVs with defective rearview cameras in March 2026. NHTSA data shows only 25% of recalled vehicles ever get fixed, leaving an estimated 1.4 million drivers blind in reverse.

America’s Most Dangerous Vehicles Aren’t Its Deadliest. Only 5 of 15 Overlap.
Only 5 of 15 vehicles appear on both the highest death rate and highest body count lists. FARS data reveals a 147-rank divergence between personal risk and population-level harm.

America’s Best-Selling Sedans Are Its Deadliest. Its Best-Selling SUVs Are Its Safest.
The Camry, Civic, and Corolla kill at 2.2x the rate of niche sedans. The RAV4, CR-V, and Equinox are 8x safer than niche SUVs. Same word — “bestseller” — opposite body counts.

At 4,000 Pounds, Your Vehicle Stops Getting Safer. It Just Gets Deadlier.
A 2025 IIHS study found that vehicle weight stops protecting drivers above 4,000 lbs. FARS data confirms: the Ram 2500 survives 80% of its fatal crashes. The person in the other car doesn’t.

One Redesign Erased 84% of a Car’s Deaths. Most Recalls Don’t Come Close.
The 2020 Sentra redesign cut model-year deaths from 173 to 30. FARS data shows platform redesigns routinely save more lives than defect recalls.

Your Car Has a Kill Curve. Sports Cars Peak at 5. Everything Else at 14.
FARS model-year data reveals class-specific death curves: sports cars kill at age 5, while sedans, SUVs, pickups, and vans all peak at 14–16. Deaths double between ages 10 and 14.

The Honda CR-V Killed 2,072 People. You Still Think It’s Safe.
FARS data reveals the CR-V has the 3rd worst death rate among compact SUVs at 0.53 per 100M VMT. An estimated 1,324 excess deaths compared to the RAV4. Its drivers are the most sober in class.

America’s Safest Minivan Just Got Recalled for the One Thing Keeping It Safe
The Chrysler Pacifica is 7x safer than the Grand Caravan it replaced. Now 178,000 of them have defective side curtain airbags. FARS data quantifies the stakes.

A Mazda CX-5 Kills 15 Owners Per Million Per Year. A Chevy S-10 Kills 652.
NHTSA measures vehicle safety per mile driven. That metric is hiding the actual risk to you. A new owner-risk calculation reveals a 43x gap between the safest and deadliest vehicles on American roads.

Every Vehicle Class Drinks at the Same Rate. Only One Class Walks Away.
FARS toxicology data shows impairment rates across all five vehicle classes cluster within 4.4 percentage points. Lethality diverges by 19.3 points. The driver behavior is constant. The engineering is not.

Every Automaker in America Is Suing to Kill a Rule That Would Save 360 Lives a Year
The Alliance for Automotive Innovation filed suit to repeal NHTSA's AEB mandate. IIHS data: AEB cuts rear-end crashes 50%. Each year of delay costs roughly 360 lives.

The Sporty Version of Your Car Is Up to 5.7x More Likely to Kill You
Hyundai Elantra: 1.50 deaths per 100M VMT. Its sporty sibling, the Veloster: 8.54. Four brands, four body bags, one engineering pattern.

Your Rental Company's Default Option Is 4.6x Deadlier Than the Upgrade
The economy sedan at the rental counter kills at 2.31 per 100M VMT. The compact SUV upgrade: 0.50. That $12/day difference is a survival calculation.

Body-on-Frame SUVs Are Up to 12x Deadlier Than Unibody Crossovers From the Same Brand
The Chevy Tahoe kills at 2.49 per 100M VMT. The Traverse manages 0.20. Same dealer, same logo, 12.5x the body count.

The Ford E-350 Is 18 Times Deadlier Than the Van Ford Built to Replace It
776 dead. Rate of 2.51 per 100M VMT. Its successor, the Transit, sits at 0.14. And 84% of the drivers were sober.

The 2013 Elantra Killed More People Per Unit Than Any Civic Ever Made
338 dead from a single model year. 1.37 deaths per 1,000 sold. The airbag let the dummy’s head slide off in small overlap testing.

629,000 Palisades Got Recalled. The Cars Actually Killing You Didn’t.
NHTSA mobilized for a vehicle with 38 deaths. Meanwhile, 24 common models with 63,563 combined deaths got nothing. The recall system has a 33%-of-all-deaths blind spot.

Your Brand’s Body Count Has an Expiration Date
The average Mercury in a fatal crash is 16.3 years old. The average Kia is 5.6. That 10.7-year gap reveals more about brand safety than any star rating.

Toyota’s Immortal Truck Has a Mortality Problem
71% of Tacoma fatal crash victims were in pre-2010 models. The truck that never dies mechanically is killing people because it stays on the road decades past its safety expiration date.

Nissan’s Subprime Death Pipeline
FARS data shows Nissan sedans kill at 4x the rate of Nissan SUVs, with identical impairment profiles. NMAC’s subprime lending funnels buyers into the deadlier half of the lineup.

Same Price, Different Coffin: The Death Rate Lottery Hiding in Your Car Payment
FARS data reveals 4-8x death rate spreads between vehicles at the same price point. Your sticker price tells you nothing about your chances of survival.

The Fleet Retirement Dividend: America’s Deadliest Vehicle Generation Is Finally Dying
Vehicles built between 2000 and 2006 are responsible for 69,625 FARS deaths. At 4.5% annual scrappage, the deadliest cohort in American history is finally aging off the road.

The Recession Saved 7,500 Lives and Nobody Noticed
Cross-tabulating FARS model-year deaths with US auto sales reveals the 2008 crash created a “ghost fleet” of never-sold vehicles that prevented thousands of fatal crash appearances.

The Truck That Isn’t a Truck Has the Lowest Death Rate of Any Midsize Pickup
The Honda Ridgeline kills at 0.24 per 100M VMT. The Ford Ranger: 2.91. A 12x spread within a single vehicle class, explained by unibody vs body-on-frame construction.

Hyundai’s Breakout Hit Produced the Largest Death Spike of Any Modern Midsize Sedan
FARS data reveals the 2011 Sonata YF caused a 238% model-year death spike. Sales doubled. So did the per-unit fatality rate.

The Brands With America’s Drunkest Drivers Are the Expensive Ones
FARS toxicology across 490K drivers: Infiniti tops impairment at 24.4%. Toyota sits at 19.1%. Within-brand model spread dwarfs the gap between brands.

Drunk or Sober, the Car Doesn’t Care
Within a vehicle class, impairment rates have zero correlation with crash lethality. Simpson’s Paradox strikes again: the steel determines who survives, not the BAC.

The Biggest Sedans in America Are Also the Deadliest. It’s Not a Coincidence.
Retiree sedans average 74.2% lethality in FARS data. Modern crossovers average 53%. Mass doesn’t save you when your bones are the crumple zone.

The Death Concentration Index: Chronic Killers vs. One Bad Generation
Borrowing the Herfindahl-Hirschman Index from antitrust law and applying it to FARS data reveals which vehicles kill uniformly across every generation and which had one catastrophic design era.

The Deadliest Vintage: How Six Model Years Killed 59,284 Americans
Model years 2000–2005 account for one-third of all fatal crash deaths from 2014 to 2023. The peak vintage — 2005 — killed 11,363 people. FARS data reveals a death mountain shaped by weak safety mandates, high production volume, and demographic filtering.

Drunk Driver Armor: The Vehicles That Let Impaired Drivers Walk Away While Their Victims Don’t
A novel FARS cross-tabulation multiplies vehicle protection ratio by impairment rate to reveal which vehicles most effectively shield drunk drivers from the consequences of their own crashes.

Impairment Doesn’t Explain Your Car’s Death Rate. We Did the Math.
Cross-tabulating 307 vehicle models reveals a flat 20% impairment constant across all classes. The 200x gap in death rates is almost entirely a vehicle engineering story.

Your “SUV” Protects You Like a Sedan. FARS Data Exposes the Crossover Lethality Gap.
Nissan Kicks occupants die in 73.9% of fatal crashes. Audi Q5 occupants: 32.2%. Both are classified as SUVs. A 2.3x lethality spread within a single vehicle class.

24 Vehicle Models Kill Half of America. The Other 313 Split the Rest.
Only 7% of vehicle models account for 50% of all FARS traffic deaths. Two completely different top-10 lists. Almost zero overlap. No silver bullet.

America’s Favorite Vehicle Class Has a 14x Death Rate Spread. Nobody Tells You Which End You’re On.
Mazda CX-5: 0.12 deaths per 100M VMT. Jeep Cherokee: 1.73. Same class. Impairment rates nearly identical. FARS data on 13 compact SUVs reveals the choice nobody talks about.

The Pickup Inversion: How Truck Size Determines Who Dies
Compact pickups kill their own drivers at 69% rates. Heavy-duty trucks export 66% of fatalities to other road users. The crossover happens at 5,500 pounds.

The Safety Half-Life: Which Vehicles Are Still Killing People in Their Newest Form?
A novel FARS metric reveals which vehicles concentrated their fatalities in old models and which are still deadly in recent form.

1 in 5 Impaired Fatal Crash Drivers Were on Alcohol AND Drugs
Decomposing FARS toxicology into alcohol-only, drug-only, and poly-impaired by vehicle model reveals a pattern BMW M5 and Buick Park Avenue share.

The Honda Accord Is the Deadliest Midsize Sedan in America
FARS data reveals a 5.3× death rate gap between America’s safest and deadliest midsize sedans. The answer isn’t driver behavior.

The Traverse Has a 0.20 Death Rate. IIHS Says It’s Not Safe Enough.
IIHS stripped safety awards from vehicles with some of America’s lowest death rates while handing them to cars with rates 7.5× worse.

The RAV4 Has a 0.19 Death Rate. The Corolla It Replaced? 1.85.
The Toyota RAV4 is 9.7 times safer per mile than the Corolla. Across 15 sedan-to-crossover pairs, the migration away from sedans may be saving 1,500 lives a year.

One in Five Cars on U.S. Roads Has an Unfixed Recall. The Fix Costs $0.
58.1 million vehicles have at least one open recall. 14 million have two or more. The repair is free. The completion rate for cars over 10 years old is 15%.

77% of New Cars Can Detect Motorcycles. The Other 270 Million Vehicles Can’t.
IIHS now tests AEB against motorcycle targets. Most new cars pass. But the average vehicle on the road is 12.6 years old and has no motorcycle detection at all. 6,335 riders died last year.

FARS Says 9% of Fatal Crashes Involve Drugs. The Real Number Is Closer to 55%.
A peer-reviewed study of 138,505 fatally injured drivers found 55% tested positive for nonalcohol drugs. FARS per-vehicle data shows 8.7%. Three systemic failures explain the 6x undercount.

A $22,000 Kia Sedan Protects Your Kids Better Than Any Minivan on Sale
Zero out of four minivans earned an IIHS safety award in 2026. The Honda Odyssey scored Poor for rear-seat protection. A Kia K4 starting at $22,290 got Top Safety Pick+. Your family hauler is a front-seat safety pod.
A 16-Year-Old Pays 376% More for Car Insurance. The Crash Data Says They Should Pay 193%.
Teen drivers crash at 3x the rate per mile. Insurers charge 4.8x more. We ran the overcharge calculation, found 7 ways to cut premiums 20-50%, and discovered Hawaii banned age-based rating and nothing broke.

Your Safety Vest Makes You Invisible to the Car That’s Supposed to Save You
IIHS tested pedestrian AEB on three vehicles. Two couldn’t detect a dummy wearing reflective safety strips—0 mph braking, 100% hit rate. The federal government mandates both the clothing and the technology. They cancel each other out.

Your Garage Door Is Better Regulated Than Your Car Seat
A 2-year-old was crushed by a Hyundai Palisade power seat. Power windows killed children for 35 years before automakers added an $8 fix. Your garage door has had mandatory anti-crush protection since 1993. Your car seat still doesn’t.

FSD Is Trying to Replace the Safest Drivers in America
NHTSA is investigating 3.2 million Teslas for FSD failures. FARS data shows Tesla drivers already have the lowest crash rate of any vehicle in the dataset. The paradox: FSD may be making America’s safest fleet less safe.

39,345 Dead. NHTSA Calls It Progress.
NHTSA’s 2024 preliminary data shows fatalities dropped below 40,000 for the first time since 2020. Our FARS decomposition reveals 72% of deaths come from pre-2012 vehicles simply aging off the road. Progress by attrition.

Vehicle Class Explains 2% of Death Rate Variation. The Other 98% Is the Model You Picked.
FARS data on 285 vehicles reveals within-class death rate spreads of 94x to 256x. The between-class difference? Just 2.1x. Buying an SUV ‘for safety’ is statistical noise.

Some Cars Kill You Before Their First Oil Change
Most fatal vehicles in FARS are 12–18 years old. A handful kill disproportionately within 1–5 years of manufacture. Three failure modes explain why new cars come with their own category of lethality.

Your Car’s Death Rate Is Hiding Two Completely Different Failures
Some vehicles crash constantly but protect you. Others almost never crash—but when they do, you die. FARS data reveals a two-axis safety map that the single death-rate number was designed to obscure.

One Corporation, 51,687 Deaths: GM’s Multi-Brand Body Count
Chevrolet, GMC, Buick, Pontiac, Cadillac, Saturn, Oldsmobile. Seven brands, one parent company, 27% of all FARS fatalities. Brand-level data splits the deaths across seven ledgers. Stack them and the concentration is staggering.

The Toyota Solara Has the Soberest Drivers in FARS — and a Death Rate 4x the Fleet Average
A z-score gap analysis of 200 vehicles separates cars that kill through engineering failure from those that kill through driver behavior. The Solara’s 4.1% impairment rate is the lowest in the dataset. Its death rate tells a different story.

Every Car Has the Same Drunk Drivers — So Why Do Death Rates Vary 285x?
Impairment rates hold steady at ~20% across 200 vehicle models. Death rates swing from 0.03 to 8.54 per 100M VMT. R² = 0.038. The vehicle is the variable, not the driver.

33 Vehicles Hit the Same Death-Rate Cliff Between 2018 and 2021
FARS model-year data reveals a synchronized 64% fatality collapse across sedans, SUVs, pickups, and muscle cars. The cause wasn’t a single recall. It was a quiet revolution.

Your Favorite Brand Doesn’t Care if You Live
Within-brand variance in fatality rates is 5.9× higher than between-brand variance. FARS data proves the badge means nothing.

The Mazda CX-5 Is the Safest Compact SUV You’re Not Buying
With a 0.12 fatality rate per 100M VMT, the CX-5 is 3-8x safer than the CR-V, Escape, and Equinox — and its drivers are actually more impaired, not less.

The Honda Accord Owes America 4,858 Lives
If every vehicle killed at the same rate relative to its fleet size, the Honda Accord should have 2,244 deaths in FARS. It has 7,102. A fleet-share analysis reveals which vehicles produce excess deaths.

A $30 Part Was Missing From 9 Million Cars. FARS Data Shows the Fallout.
Hyundai and Kia skipped engine immobilizers on millions of vehicles. Then TikTok taught teenagers to steal them. The FARS model-year data traces the body count.

The Average Car That Kills You Is 12.5 Years Old
Cross-tabulating 187,000 FARS fatalities by model year reveals the killing fleet isn't junkers or new cars. It's the enormous middle-aged bulk of America's 12-year-old vehicles.

These Cars Got Deadlier as They Got Newer
Eight models defied the safety curve — their 2016-2022 versions killed 67% to 144% more people than their predecessors. We cross-tabulated all 337 FARS models to find the ones moving backward.

Some Brands Are Safe Bets. Others Are Russian Roulette.
Chevrolet's death rate spread: 39×. Subaru's entire lineup stays below 1.0. We calculated the within-brand standard deviation for every major manufacturer. Brand loyalty is not a safety strategy.

The Convertible Rollover Gap: Which Open-Top Cars Actually Protect You, and Which Ones Just Look Like They Do
Fixed steel hoops vs. pyrotechnic pop-up bars vs. reinforced A-pillars. We compared rollover protection across nine popular convertibles. Track day organizations already know the answer.
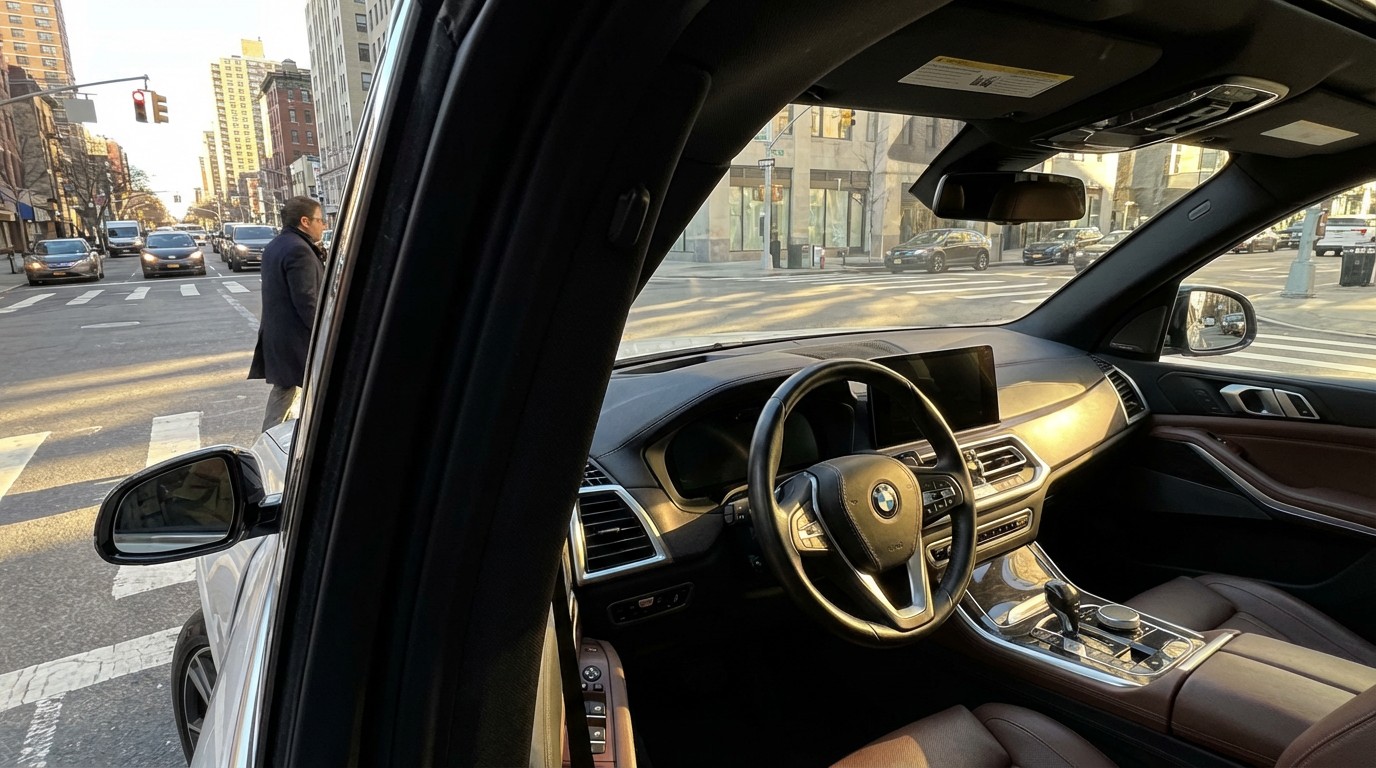
Your Car Was Designed to Save You in a Rollover. Not to See the Person in the Crosswalk.
IIHS measured blind zones in 168 vehicles. A large A-pillar blind zone raises left-turn pedestrian crash risk by 70%. A 4’11” driver faces 33% vision blockage. The pillars that save occupants hide pedestrians.

919,000 Crashes. 2,872 Dead. Nobody Stayed.
Hit-and-run crashes hit a record 15% of all police-reported crashes in 2023. One in four pedestrians killed was left on the road. The poorest ZIP codes absorb six times the deaths.
One in Three Dead Motorcyclists Weren’t Licensed to Ride. The System Doesn’t Care.
35% of motorcyclists killed in 2023 had no valid license. The rate spiked during COVID and never came back down. The licensing system isn’t a safety mechanism. It’s a fee.
The Deadliest Speed Limit in America Is 45 MPH. It’s Posted on Every Suburban Boulevard You Drive.
45 mph is where a pedestrian’s chance of dying crosses 50%. It’s also the most common speed limit where drivers kill pedestrians. Three independent datasets converge on the same number.
25% of Driving Happens at Night. 50% of the Dying Does Too.
A Cochrane meta-analysis of 17 studies found street lighting reduces fatal crashes by 66%. America has millions of miles of unlit road. Three multipliers—visibility deficit, behavioral overlay, and infrastructure absence—compound against every nighttime driver.
42% of Drivers Killed in Crashes Had THC in Their Blood. America Has No Idea What to Do About It.
America counts alcohol-impaired driving deaths with confidence. For cannabis, it can’t even agree on what “impaired” means. Three systemic failures explain the void.

20% of Americans Live in Rural Areas. 41% of Traffic Deaths Happen There.
Per-capita rural traffic death rate: 2.8x urban. Three independent clocks compound against every crash victim: speed severity, 28-minute longer EMS response, and 182 closed hospitals since 2010.
7,314 Pedestrians Died in 2023. America’s Roads Were Designed to Kill Them.
76% die in the dark. 65% where no sidewalk exists. 54% involve SUVs or pickups. When all three converge, survival drops below 15%. The safety tech designed to help doesn’t work at night.

The Motorcycle Safety Scissors: How 50 Years of Car Safety Left Riders Behind
Car deaths fell from 69% to 59% of traffic fatalities. Motorcycle deaths tripled from 7% to 15%. The FARS lines cross. Every major safety technology explicitly excluded riders.

The Unbuckled 8%: A Tiny Minority Produces Nearly Half of America’s Traffic Deaths
Only 8.8% of front-seat occupants skip the seatbelt. They account for 44% of passenger vehicle fatalities. FARS cross-tabs reveal the composite profile.
The 40-Inch Line: Above It, Your Truck’s Front End Becomes a Pedestrian Death Machine
IIHS studied 17,897 crashes and found hoods over 40 inches are 45% more likely to kill pedestrians. Trucks got 11% taller. Pedestrian deaths surged 80%.
Ram Split From Dodge and the Death Rate Didn’t Follow
4.8 deaths per 100M VMT from 8,412 fatal crashes. The Ram 1500 sits in third place among full-size trucks — worse than the F-150, better than the Silverado.
GM Bought a Bankrupt Korean Automaker and Sold You Its Deadliest Car for $9,995
89% crash lethality — second worst in FARS. The Chevrolet Aveo was a Daewoo Kalos with a bowtie, sold as America’s cheapest car.
Saturn’s Dent-Proof Panels Couldn’t Stop It From Being the Deadliest Car Per Crash in America
92.4% lethality rate — worst in the FARS database. The polymer body panels that survived shopping carts couldn’t save anyone at highway speed.
The Car With America’s Drunkest Drivers Is a Buick
The Buick Park Avenue leads every vehicle in the FARS database for impaired-driver fatal crashes at 31.7%. It beats the Corvette, the Mustang, and the Camaro.
Nissan Called the Maxima a “4-Door Sports Car.” The Fatality Data Agrees.
At 5.11 deaths per 100M VMT, the Maxima is deadlier than the Camaro, the Corvette, and the Challenger. Nissan’s marketing was more accurate than they intended.

The F-150 Was Involved in 20,066 Fatal Crashes. In 10,872 of Them, Someone Else Died.
When pickups crash, more than half the fatalities are outside the truck. The Ram’s 5,703 external kills would rank between drowning and fire as a cause of death. Nobody tracks this metric.
86% of Cavalier Crashes Are Fatal. For a Ram 2500, It’s 21%.
Death rates tell you how often a vehicle crashes. Lethality ratios tell you what happens next. In 337 models of FARS data, the survivability gap is 4 to 1 — and it tracks perfectly with weight.
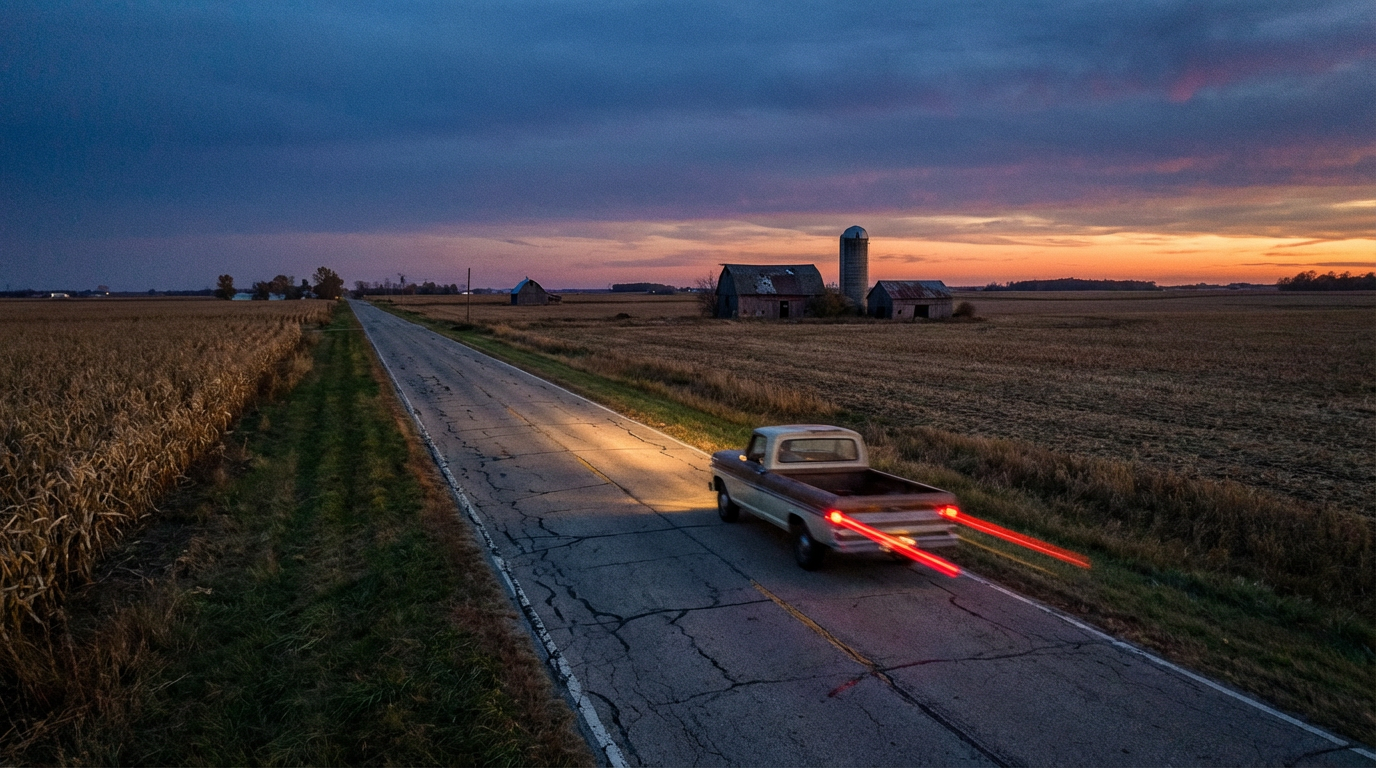
Mississippi Kills Drivers at 5× the Rate of Massachusetts. They Drive the Same Cars.
24.9 deaths per 100K vs. 4.9. Same Camrys, same F-150s. The gap isn’t the vehicles — it’s the roads, the speeds, and the distance to a trauma center.
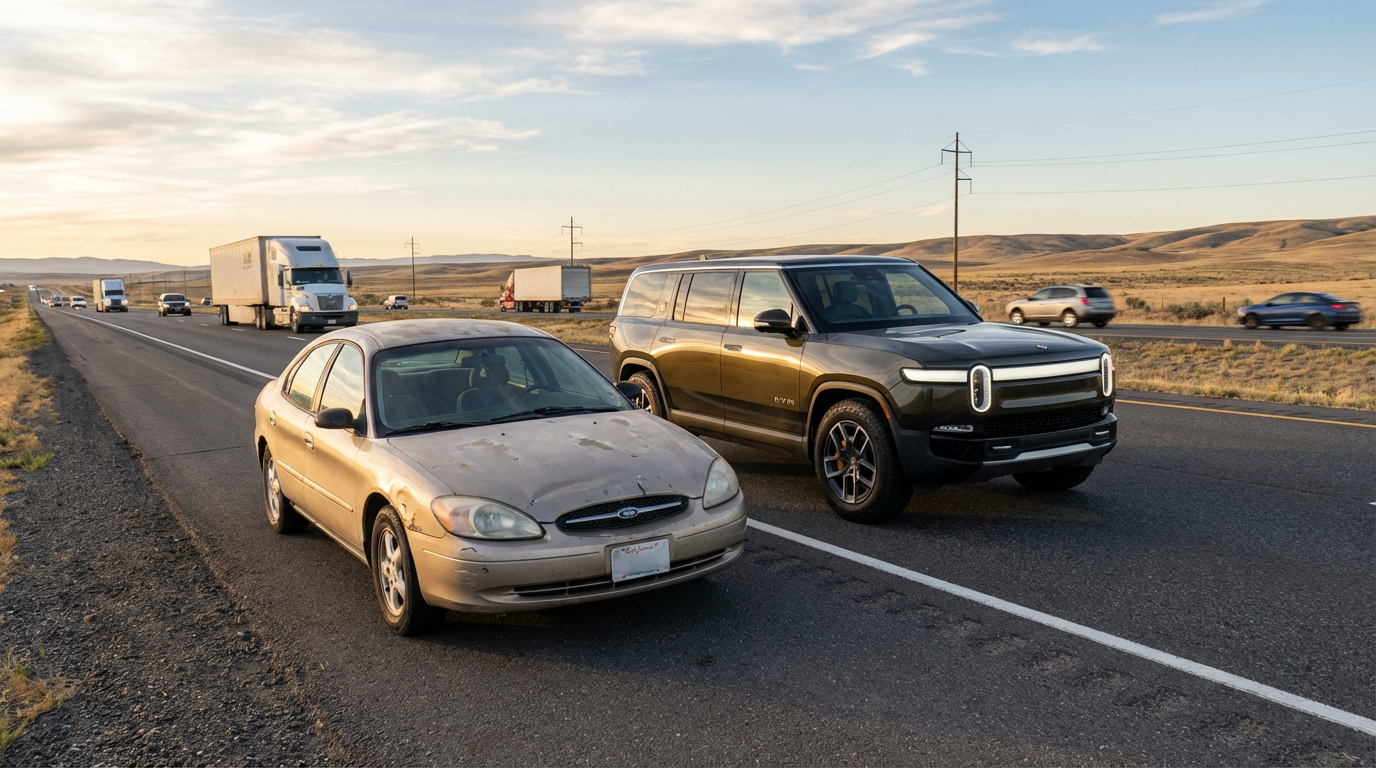
Congress Saved 9,000 Lives a Year in 2007. The Cars Didn’t Get the Memo Until 2024.
The ESC mandate passed in 2007. Full fleet penetration took 17 years. In the gap: roughly 40,000 people died in vehicles that would have had stability control if the fleet turned over faster.
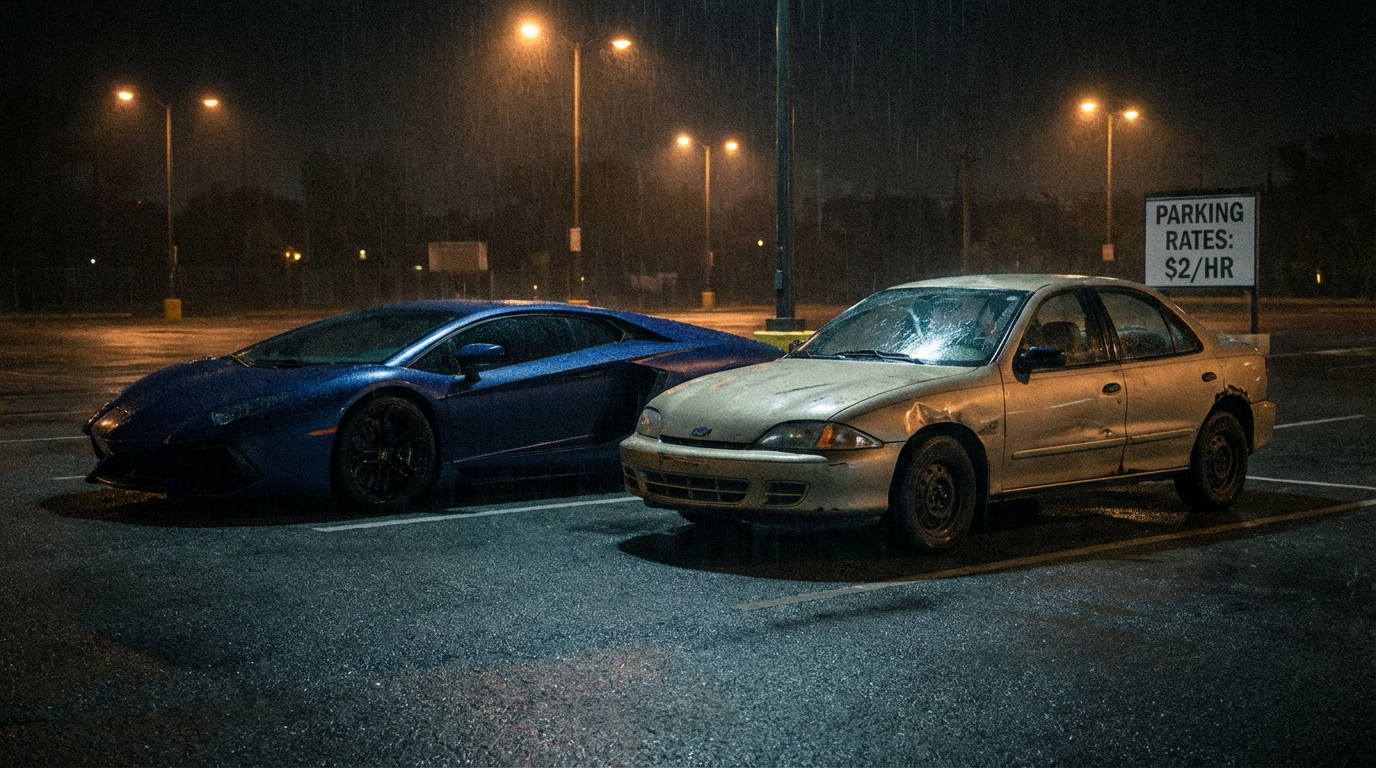
A Porsche 911 Driver Drinks as Much as a Cobalt Driver. One Is 7× More Likely to Survive.
Impairment rates are nearly identical across price points — 22.8% vs 22.4%. Death rates differ by up to 26.5×. Safety in America is a luxury good, and the data proves it.

80% of Fatal Crash Drivers Were Sober. America Spent $800 Million on the Other 20%.
490,736 drivers in fatal crashes. 80% had zero impairment. NHTSA spends $800M/year chasing the minority. The Toyota Solara’s 4.1% impairment rate is the lowest in FARS. Its death rate is 3× the Camry’s.
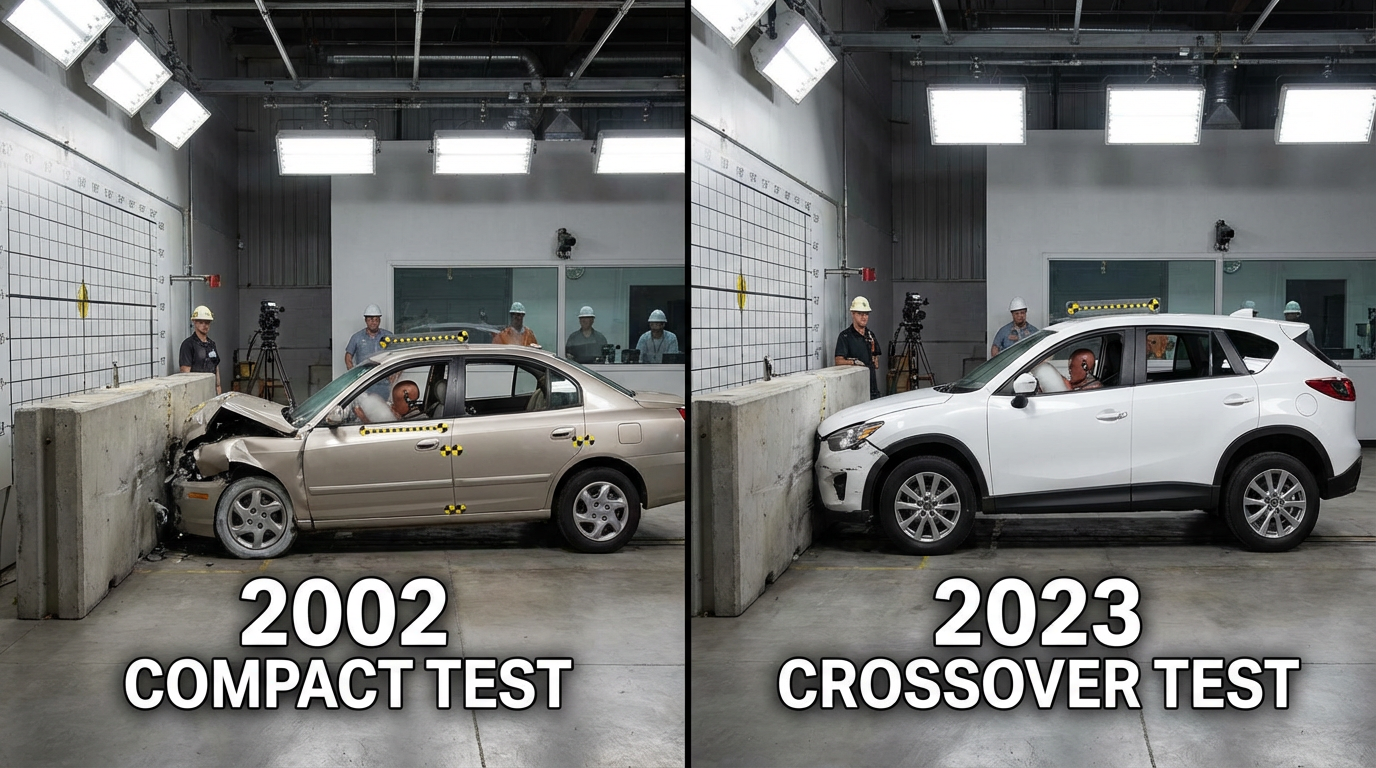
Seven Vehicles That Got 8–22× Safer in a Single Generation
The Tracker killed at 7.83. Its Equinox replacement does 0.36. That’s a 22-fold improvement. Seven vehicles, seven engineering events, and the three changes that explain all of them.
Sedans Kill at 2.5× the Rate of SUVs. Every Single Brand.
89,127 sedan deaths vs 46,442 SUV deaths. Across every major automaker, the sedan is deadlier per mile than the SUV. The gaps range from 2× to 25×. No exceptions.
GM Built One Minivan and Sold It Four Times. All Four Were Deadly.
715 deaths across the Venture, Montana, Uplander, and Silhouette — four badges on one bad platform. The Sienna was 3.6× safer per mile. GM’s exit from minivans was a retreat, not a pivot.
Half the People Dying on American Roads Are Dying in Cars That Don’t Exist Anymore
46.7% of all FARS fatalities came from vehicles built before 2006. Nine discontinued models have 100% of their deaths from the ghost fleet. 87,320 people killed in cars no manufacturer will defend.
The Chrysler Sebring Had the Lowest Impairment Rate in Its Class. It Killed 664 People Anyway.
17.6% impairment — lowest of any midsize sedan in FARS. Yet at 1.65 deaths per 100M VMT, sober people were dying in a car that folded on impact. Then Chrysler fixed it, got worse drivers, and the death rate dropped anyway.
Honda’s Sedans Are Deadly. Honda’s SUVs Are Among the Safest Cars in America.
The Accord kills at 3.07 per 100M VMT. The Pilot kills at 0.29. Same brand, same dealership, 10.6× safety gap. Honda’s two best-selling sedans have killed 13,655 people.
The Dodge Neon Was America’s Disposable First Car. It Killed 602 People.
23.2% impairment including 11.8% drug-positive — nearly double the national average. Model year 2005 alone: 159 deaths. The car nobody chose on purpose became a toxicology case study.
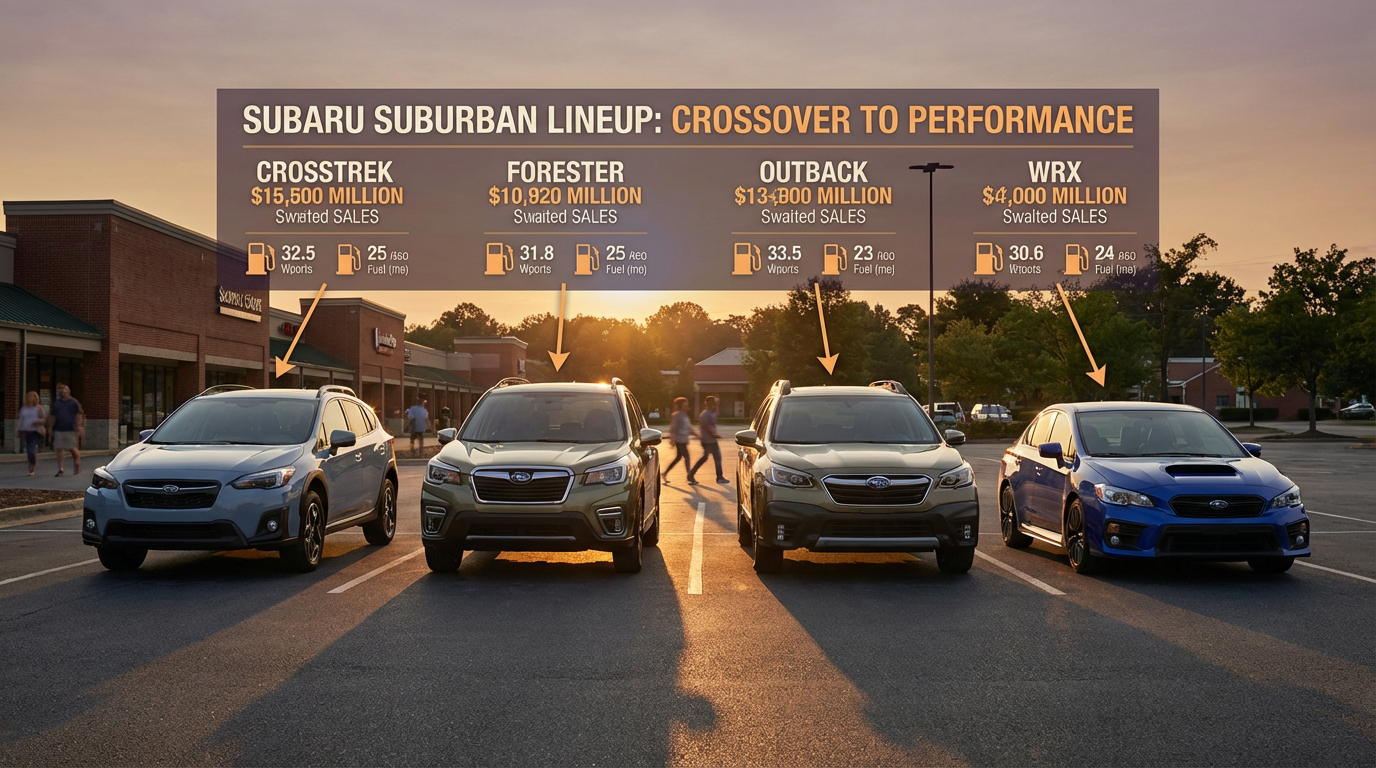
Every Subaru Is Safer Than Its Competitors. Every Single One.
Crosstrek at 0.08 is 12× safer than the Ford Escape. WRX at 0.29 is 21× safer than the Mustang — despite higher impairment. Seven models, seven class wins. The brand nobody recommends for safety is the safest brand in the database.
The Toyota Prius Is the Safest Sedan in America. Its Drivers Are the Soberest, Too.
The Prius kills at 0.55 per 100M VMT — 3.4× safer than the Corolla, 5.6× safer than the Accord. 16% impairment rate — lowest of any major sedan. The car everyone mocks is the one that’s least likely to kill you.
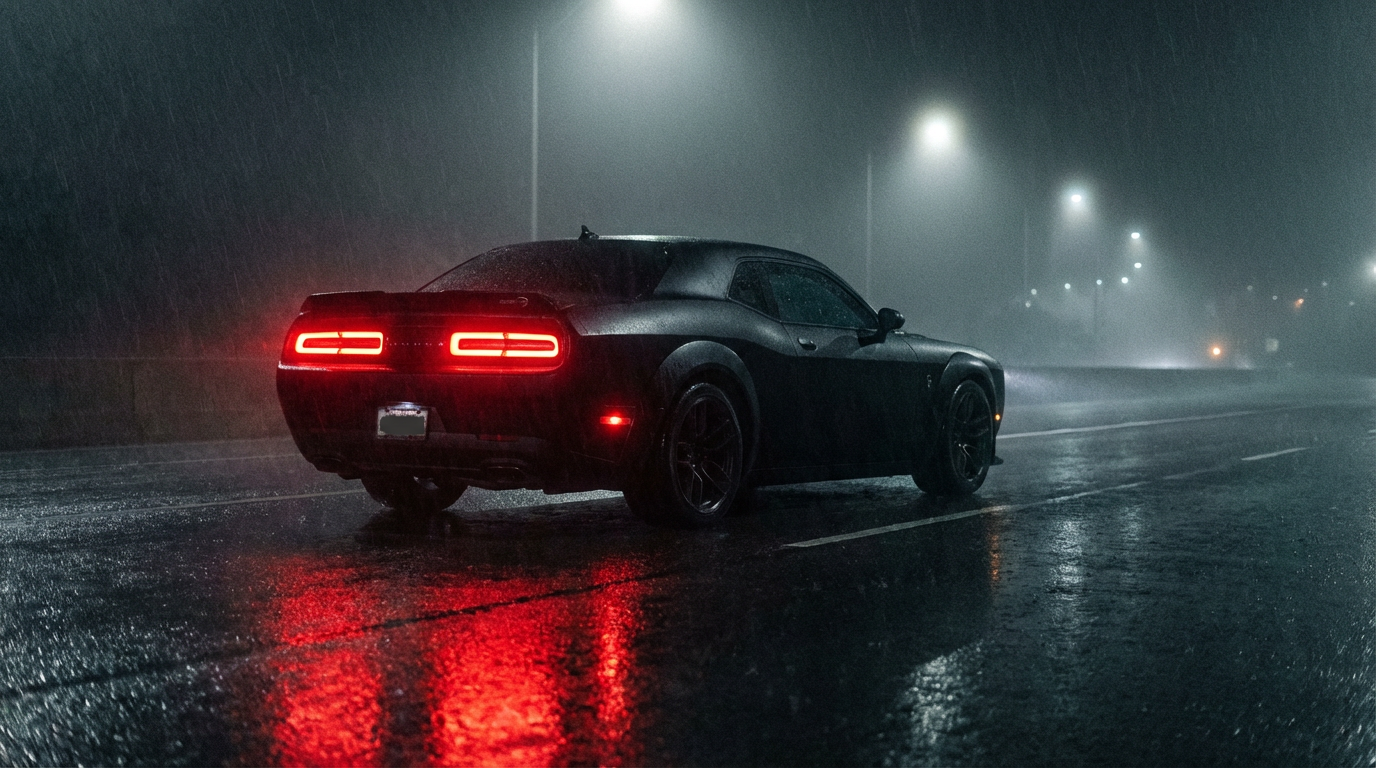
The Dodge Challenger Is the Safest Muscle Car in America. Nobody Believes It.
The Challenger kills at 1.00 per 100M VMT — 6× safer than the Mustang, 3.4× safer than the Camaro. Same impairment rates across the segment. It’s the heaviest, the oldest-skewing, and the one nobody thought to check.
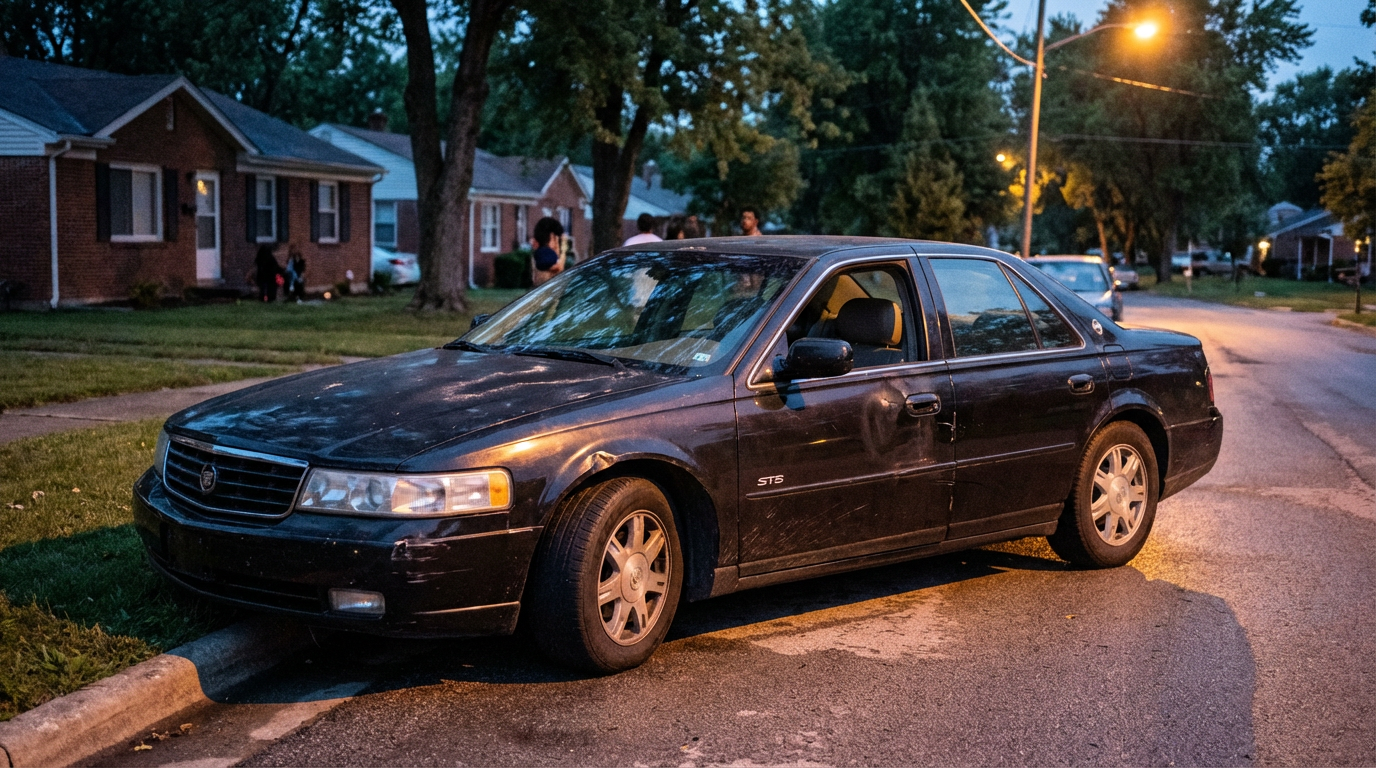
The Cadillac Seville Had the Lowest Impairment Rate in the Database. It Killed 391 People Anyway.
Cadillac’s premium sedan has the highest death rate of any luxury car in FARS — 3.89 per 100M VMT. Its drivers were the soberest in the database at 10.5% impairment. The DeVille, one rung down the ladder, is 10× safer.
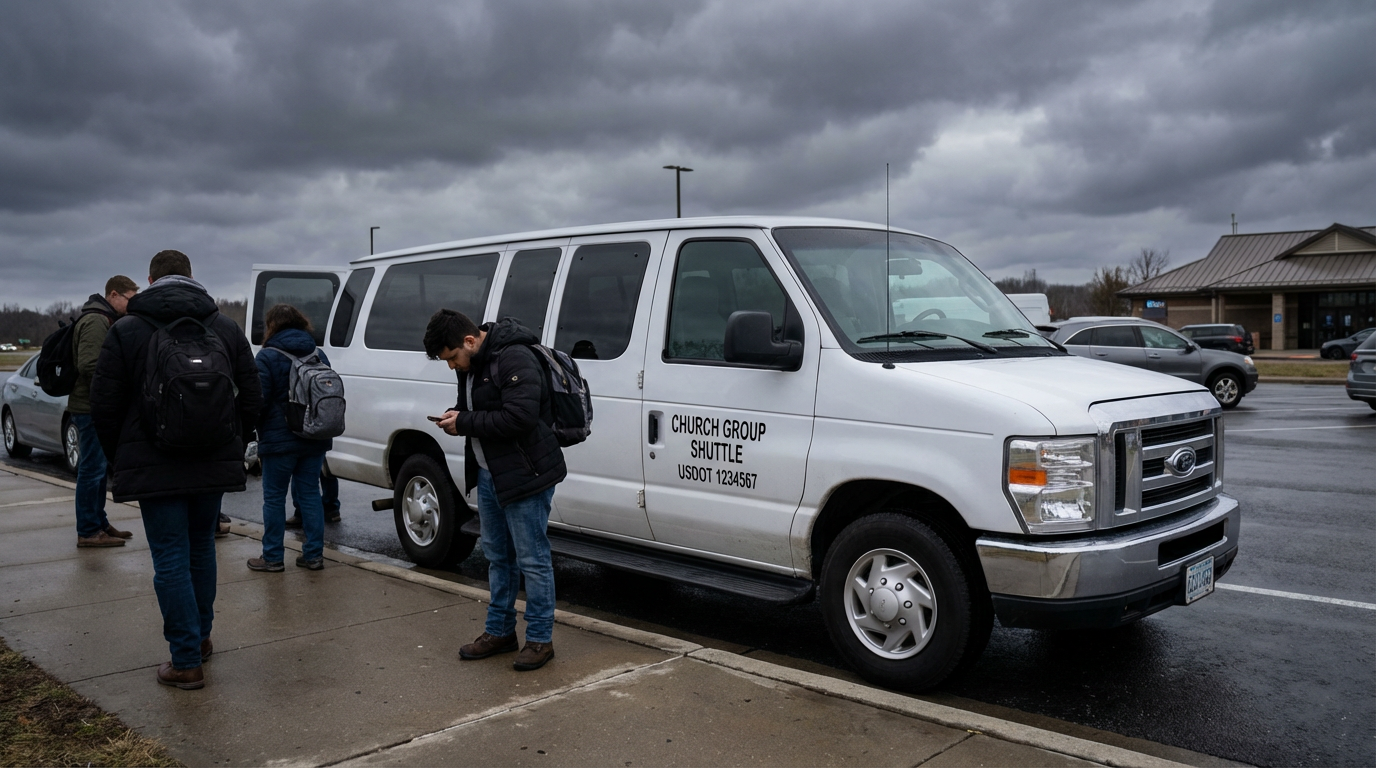
The Ford E-350 Killed 776 People. Most Were Passengers.
America’s default church bus, airport shuttle, and hotel van has the highest death rate of any commercial vehicle — 2.51 per 100M VMT. Its replacement, the Transit, kills at 0.14. An 18-fold safety gap Ford took 54 years to close.
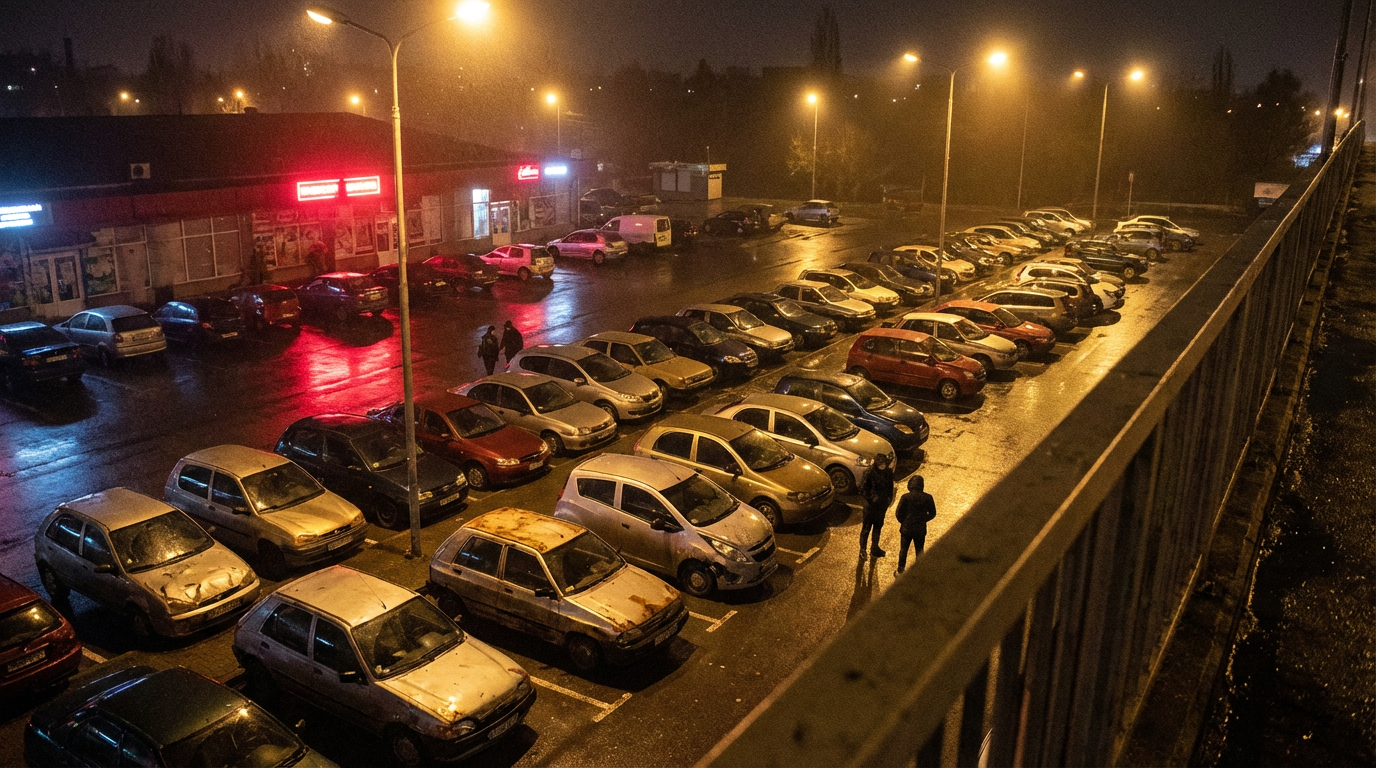
America’s Cheapest Cars Are a Death Lottery. The Odds Depend on the Badge.
The Chevy Sonic kills at 1.40 per 100M VMT. The Mitsubishi Mirage manages 0.40. A 3.5× safety gap in the segment where buyers can least afford to get it wrong — and GM’s sober Spark drivers are dying at higher rates than Hyundai’s drunk Accent drivers.
The Toyota 4Runner Is 5× Deadlier Than the RAV4. Guess Which One Toyota Calls “Rugged.”
1,418 deaths and a 1.00 rate per 100M VMT make the 4Runner Toyota’s most dangerous SUV — 5× deadlier per mile than the RAV4, 2.4× the Highlander. Same company, similar buyers, radically different body counts.
The Chevy Silverado Is the Deadliest Vehicle in America. The F-150 Is Catching Up.
9,591 deaths — more than any other vehicle in FARS. Add the Sierra badge twin and GM’s full-size truck platform has killed 12,928 people. The F-150 is 20% safer per mile. The Ram is 37% safer.
The Volkswagen Jetta Promised German Engineering. It Delivered 1,375 Deaths.
VW’s own Golf on the same platform scores 0.18 deaths per 100M VMT. The Jetta? 1.71. That’s 9.5× deadlier — same company, same architecture, radically different outcomes.
Minivan Drivers Are the Soberest People on the Road. And It’s Not Even Close.
Minivans average 15.4% impairment in fatal crashes vs. 20% nationally. Sports cars hit 22.5%. The Grand Caravan and Odyssey clock in at 15.3% and 15.4%. The car you drive is a behavioral confession.
GM Sold the Same Deadly SUV Twice. The Yukon and Tahoe Have Killed 3,706 People.
Same platform, same factory, same death rate. The Yukon (2.55) and Tahoe (2.49) are mechanically identical — and 3× deadlier per mile than the Toyota Sequoia. Add the Suburban and it's 4,299 deaths from one architecture.
Hyundai and Kia Build the Same Car. The Hyundai Kills 3.8× More People.
Same platform, same engines, same parent company. The Elantra kills at 1.50 per 100M VMT — the Forte at 0.40. The Sonata-Optima gap is 2.7×. Korean twins, wildly different body counts.
The Ford Fusion Was the Safest Midsize Sedan in America. Ford Killed It Anyway.
At 1.23 deaths per 100M VMT, the Fusion was 40% safer than the Camry and 60% safer than the Accord. Same impairment rates across the segment. Ford discontinued it in 2020.
One Designer Made the Same Deadly Car Twice. For Two Different Companies.
Bryan Nesbitt designed the PT Cruiser at Chrysler, then the HHR at GM. Same retro concept, 1,187 combined deaths. The HHR kills at 2.12 per 100M VMT — 63% deadlier per mile.
Nissan Sold the Same Truck for 16 Years. It Killed 1,030 People.
The Frontier went virtually unchanged from 2004 to 2021 while competitors redesigned around it. Rate: 1.45 per 100M VMT — 1.8× the Tacoma, 5.2× the Colorado.
The Ford Escape Is 5× Deadlier Than a RAV4. They Cost the Same.
The compact SUV segment hides a 5× safety gap: the Escape kills at 0.95 per 100M VMT while the RAV4 manages 0.19. Same price, same cross-shopping — wildly different odds.
Infiniti Built Three Generations of the Same Car. The Impairment Rate Never Changed.
The G35, G37, and Q50 span 20 years and 698 deaths. Across all three, ~24% of fatal-crash drivers were impaired — 4 points above the national average, every single generation.
The Chrysler 300 Kills 2.5× More People Than the Dodge Charger. They’re the Same Car.
Same LX platform, same factory, same engines. The “respectable” sedan kills at 1.87 per 100M VMT — the muscle car at 0.75.
Toyota Built a Camry Coupe. It’s 2× Deadlier Than the Camry.
The Solara shares its platform, engine, and factory with the Camry. It kills at 4.25 per 100M VMT — more than double the Camry’s 2.03. Only 4.1% impairment. Sober people dying in a Toyota.

Pontiac Died in 2010. It Has Killed 3,038 People Since.
GM killed the brand, but 2.45 million Pontiacs still haunt American roads — Grand Prix (970 deaths), G6 (908), Grand Am (713). Every single FARS death came from a ghost.
The Dodge Dakota Was 3× Deadlier Than a Tacoma. Dodge Just Killed It.
At 2.62 deaths per 100M VMT from a 350K fleet, the Dakota was the second-deadliest mid-size pickup — and Dodge’s answer was to discontinue it entirely.
The Toyota Corolla Has Killed 4,945 People. It’s Still the Safest Car on This List.
The world’s best-selling car is the 4th deadliest sedan in FARS — not because it’s dangerous, but because 2.3 million of them drive 26.7 billion miles a year.
The Chevy Tracker Was a Suzuki in Disguise. It Killed 856 People.
At 7.83 deaths per 100M VMT, the rebadged Suzuki Vitara was 41× deadlier per mile than the RAV4 it competed against — and GM put a bowtie on it.
The Chevy S-10 Was 6× Deadlier Than a Tacoma. Then GM Fixed It.
At 4.83 deaths per 100M VMT, the S-10 was the deadliest compact pickup by a grotesque margin — then the Colorado replacement dropped it to 0.28.
The Ford Crown Victoria Killed 881 People. Most of Them Were on the Clock.
America’s most trusted fleet vehicle — chosen by police, taxis, and government agencies — had a fuel tank that turned rear-end crashes into cremations.
The Ford Expedition: America’s Most Trusted Family Coffin
The Chevy Cavalier Killed 1,225 People. Then GM Made Its Replacement Worse.
Grandma’s Buick LeSabre Has a Higher Death Rate Than the Toyota Camry
1,344 dead at 2.67 per 100M VMT — 32% deadlier than the Camry, with 23.5% impairment. The retirement sedan was secretly lethal.
The Jeep Wrangler Is America’s Favorite Way to Die Outdoors
At 0.84 deaths per 100M VMT, the Wrangler is the safest Jeep per mile. It still killed 1,842 people. Only 19.3% were impaired. The lifestyle vehicle paradox.
GM Built the Same Deadly SUV Twice. The Trailblazer Killed 2,473 People.
The Trailblazer's 2.83 fatality rate is nearly 2× the Explorer. Its twin, the GMC Envoy, adds 988 more deaths. One platform, two badges, 3,461 dead.
The Chevy Malibu Has Killed 3,465 People. Nobody Noticed.
The Malibu matches the Camry’s fatality rate at 2.03 deaths per 100M VMT, but generates zero headlines. The Ford Fusion is 40% safer per mile. GM’s most forgettable sedan is also its most quietly lethal.
The Chevy Tahoe Weighs 5,600 Pounds. It Didn't Help.
At 2.49 deaths per 100M VMT, the Tahoe is deadlier per mile than a Honda Civic — despite weighing nearly twice as much. The Silverado shares its platform and kills at half the rate. Size isn't safety.
Mercury Died in 2011. The Grand Marquis Is Still Killing People.
Three Ford Panther platform cars, same bones, wildly different fates. The Grand Marquis kills at 2.29 per 100M VMT — 2.7× deadlier than the Town Car (0.86). Same frame, same engine. The difference is who bought them.
The Jeep Cherokee Is 3.4× Deadlier Than the Grand Cherokee. The Name Is a Trap.
2,276 deaths at 1.73 per 100M VMT from a 1.05M fleet — while the Grand Cherokee’s 1.84M fleet manages just 0.51. Same brand, same name, 3.4× the death rate. Cherokee drivers are more sober too.
The Ford Ranger Is Nearly 3× Deadlier Than the F-150. Small Trucks Are a Lie.
3,089 deaths at 2.91 per 100M VMT. Every compact truck in FARS is deadlier per mile than its full-size counterpart — S-10 at 4.83 vs Silverado at 1.25, Dakota at 2.62 vs Ram at 0.78. Smaller doesn’t mean safer.
The Nissan Sentra Is the Cheapest Way to Die in a Sedan
2,571 deaths at 2.13 per 100M VMT — deadlier than the Corolla, Elantra, and Cruze. The Sentra is 3.4× more lethal per mile than the Cruze, and its own sibling Versa is somehow half as deadly.
The BMW 3 Series Is the Deadliest Luxury Car in America. By a Lot.
At 2.73 deaths per 100M VMT, the “Ultimate Driving Machine” is 8.5× deadlier than the Audi A4. Its 1,237 fatalities dwarf every luxury competitor, and 22.1% of its drivers in fatal crashes were impaired.
The Dodge Grand Caravan Killed 1,782 People. Almost None of Them Were Drunk.
America’s default family hauler has the lowest impairment rate in FARS at 15.3%. Its 1,782 deaths are overwhelmingly sober parents on routine trips.
The Ford Taurus Was America’s Best-Selling Car. Then It Became a Ghost.
Once the best-selling car in the country, the Taurus ended its life as a fleet-only rental sedan. Its 2.74 per-mile death rate is more than double the Fusion that replaced it.
The Honda Civic Has Killed 6,553 People. It’s Still Everyone’s First Recommendation.
The safest car in the world can still be one of the deadliest — if enough people drive it. The Civic’s 2.25 per-mile rate beats every compact rival.
The Toyota Camry Is the ‘Safest’ Car in America. It Has Killed 6,328 People.
Below-average fatality rate, 5th highest body count. The paradox of safe cars that kill thousands through sheer ubiquity.
‘Altima Energy’ Is Real. 4,787 People Are Dead.
The internet meme about reckless Altima drivers is backed by hard FARS data — 7th deadliest vehicle in America with a 2.88 fatality rate. But the impairment rate is surprisingly average.
The Dodge Charger Is America’s Favorite Bar Car. The Toxicology Reports Prove It.
Of 4,339 Charger drivers in fatal crashes, 985 were impaired — a 22.7% rate. It’s a “sedan” with a Hemi V8 and a customer base that skews thirsty.
The Ford Focus Was America’s Most Popular First Car. It Killed 3,046 People.
At 2.52 per 100M VMT, the Focus was deadlier per mile than every compact competitor — Civic, Corolla, Elantra. And 80% of fatal crashes were sober.
The Chevy Cobalt Was a Death Trap Before GM Even Admitted It
At 5.10 deaths per 100M VMT, the Cobalt is the deadliest compact sedan in the database. Its replacement, the Cruze, is 8× safer. The ignition switch scandal was just the beginning.
The Camaro Is the Second-Deadliest Sports Car in America. It’s Not Even Close to First.
At 3.44 deaths per 100M VMT, the Camaro kills at half the Mustang’s rate — but with a higher impairment percentage. 1,204 dead in a decade.
Nissan’s “Luxury” Sedan Is Twice as Deadly as the Altima
At 5.11 deaths per 100M VMT, the Maxima is nearly 2× deadlier than the Altima — and it’s not even a sports car.
Pickup Trucks Account for 1 in 5 Traffic Deaths in America
41,593 pickup fatalities over a decade. The Silverado alone tops the entire database at 9,591. But per mile, they’re safer than sedans.
The Chevrolet Impala: America’s Deadliest Rental Car
At 5.0 deaths per 100M VMT and 3,774 fatalities, the fleet-favorite Impala is 2.5× deadlier than its own sibling, the Malibu.
The Ford Mustang Has the Highest Death Rate of Any Mass-Market Car in America
At 6.02 deaths per 100M VMT and 2,739 fatalities, the Mustang is the deadliest mainstream vehicle on American roads.
The Hyundai Veloster Is the Deadliest Car in America Per Mile Driven
At 8.54 deaths per 100M VMT, this economy coupe out-kills the Mustang, Camaro, and Corvette — and its drivers are comparatively sober.

The Tesla Paradox: Silicon Valley’s Safety Darling Meets the Muscle Car’s Worst Habit
Model Y posts 0.03 deaths per 100M VMT. Model S posts a 24% impairment rate. Same brand, different species.
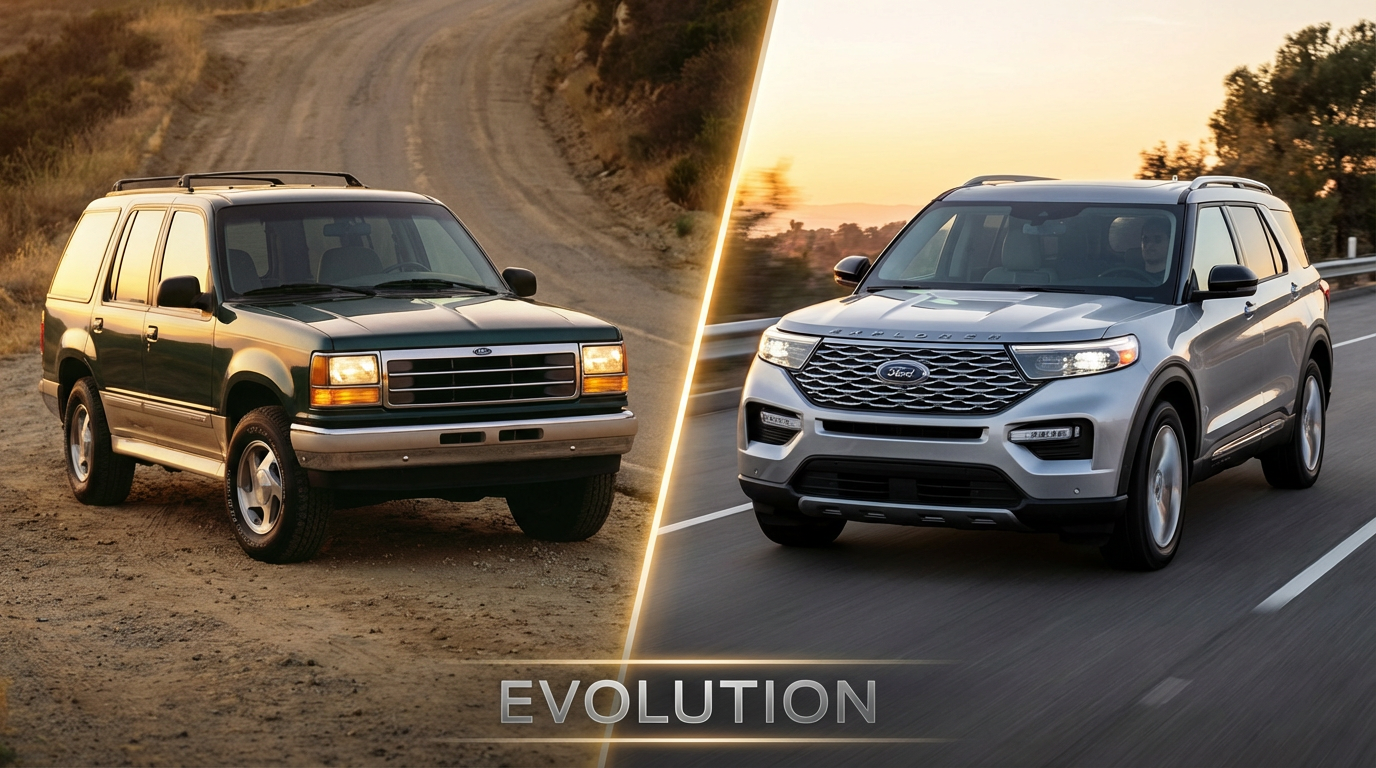
How the Ford Explorer Escaped Its Own Legacy
503 fatal crash involvements for the 2002 model year. 8 for the 2022. A 98.4% reduction.
One In Four Corvette Drivers In Fatal Crashes Is Impaired
26.2% tested positive for alcohol or drugs — the highest of any major sports car. The Buick Park Avenue hits 31.7%.
The 261x Death Gap: How Your SUV Choice Is a Life-or-Death Decision
The fatality rate gap between the Chevrolet Tracker and the Porsche Macan is 261-fold.
The Honda Accord Has Killed More People Than the Mustang, Camaro, Corvette, and Challenger Combined
7,102 Accord deaths vs. 4,648 for all four muscle cars. Ubiquity is its own kind of danger.
The Chevy Astro Van: Where 27% of Drivers in Fatal Crashes Were Loaded
A minivan out-drinks the Mustang. Impairment correlates with vehicle price, not vehicle type.
The Toyota Land Cruiser Paradox: Sober Drivers, Maximum Death
3rd-lowest impairment rate. 3rd-highest death rate. The most unsettling data point in the database.
AI-generated editorial analysis of NHTSA FARS public data. See Methodology for caveats.
NHTSA FARS national data
The Fatality Analysis Reporting System (FARS) is a census of all fatal motor vehicle crashes in the United States, maintained by NHTSA. FARS covers all crashes nationally and can be normalized by vehicle miles traveled (VMT) — but only at the broad vehicle-class level (passenger cars, light trucks, motorcycles), not per make/model.
VMT data comes from the FHWA Highway Statistics Table VM-1, which estimates total miles driven annually by vehicle type. Dividing FARS fatalities by VMT yields the "fatality rate per 100 million VMT" — the standard metric used in NHTSA Traffic Safety Facts publications.
- 2024 data is an early estimate based on NHTSA's preliminary projections and is subject to revision.
- Fatalities by road user type (2014–2023) are final FARS counts.
- Per-class VMT rates use FHWA VM-1 data matched to FARS occupant fatality counts for the corresponding vehicle type.
FARS per-model estimated rates
The FARS per-model section aggregates all occupant fatalities across 2014–2023 from NHTSA FARS bulk CSV downloads, grouped by make/model. This data includes:
- All occupant fatalities (drivers + passengers), not just driver deaths
- All model years on the road, not a single MY cohort
- All vehicles involved in fatal crashes, regardless of registration volume
Since per-model VMT data does not exist publicly, estimated fatality rates use a proxy method:
- Fleet estimate: publicly reported average annual US sales × fleet multiplier (12.5 yr average vehicle age × 0.70 survival discount ≈ 8.75 effective fleet years)
- Annual VMT estimate: estimated fleet × NHTS class-average annual miles (sedans: 11,500 mi; SUVs: 12,500 mi; pickups: 13,500 mi; vans: 11,800 mi; sports cars: 8,000 mi)
- Rate: 10-year total deaths ÷ (estimated annual VMT × 10 years ÷ 100,000,000)
Key caveats:
- Sales figures ≠ registrations — fleet size estimates are approximate
- All vehicles within a class are assumed to drive the same annual miles
- Does not account for driver demographics, geographic variation, or vehicle age distribution
- Includes models with 50+ deaths or significant annual sales (>1k) for rate comparison
Impaired driving analysis
Impairment data comes from the FARS PERSON.csv file, filtered to drivers only (PER_TYP = 1). Each driver record is joined to its vehicle record via ST_CASE and VEH_NO.
- Alcohol positive: DRINKING = 1 (police-reported) OR ALC_RES (BAC test result) between 1–94 (BAC > 0.00 g/dL)
- Drug positive: DRUGRES1/2/3 values 100–295 (specific drug detected in toxicology) OR DRUGS = 1 in older files
- Any impairment: alcohol positive OR drug positive
Key caveats:
- Toxicology testing rates vary significantly by state and jurisdiction — some states test nearly all fatally-involved drivers, others test far fewer
- Untested drivers are coded as unknown, not negative — actual impairment rates are likely higher than reported
- Only models with 100+ drivers in fatal crashes are shown to ensure statistical significance
Model year analysis
The MOD_YEAR field from FARS VEHICLE.csv identifies the model year of each vehicle involved in a fatal crash. Deaths are aggregated by (make, model, model year) across the 2014–2023 observation period.
- Older model years have more cumulative years of exposure on the road during the observation period, creating a natural age-related skew
- This chart reflects fleet-age composition and crash involvement, not inherent safety differences between model years
- Model years with fewer than 5 deaths are excluded
- Invalid model year values (0, 9998, 9999, pre-1980, or future years) are excluded
Scope: fatalities only
This dashboard covers fatal crashes only from the FARS census. NHTSA also maintains the Crash Report Sampling System (CRSS), which covers all police-reported crashes (including injuries and property damage) — but CRSS is a probability-based sample, not a census, and is not incorporated here.
Limitations
- NHTSA/FARS data: VMT normalization is only available at the vehicle-class level, not per make/model. Class-level rates mask variation within each category.
- FHWA VMT estimates are modeled from traffic counts and may not perfectly reflect actual travel.
- FARS per-model: Estimated rates depend on sales-as-fleet-proxy assumption. Vehicles with much higher or lower than average usage will have distorted rates.
Sources
NHTSA FARS database → |
NHTSA Traffic Safety Facts →
FHWA Table VM-1 →
FARS bulk CSV downloads → |
NHTS (National Household Travel Survey) →
FARS/CRSS Coding and Validation Manual →