The Ford Escape Is 5× Deadlier Than a RAV4. They Cost the Same.
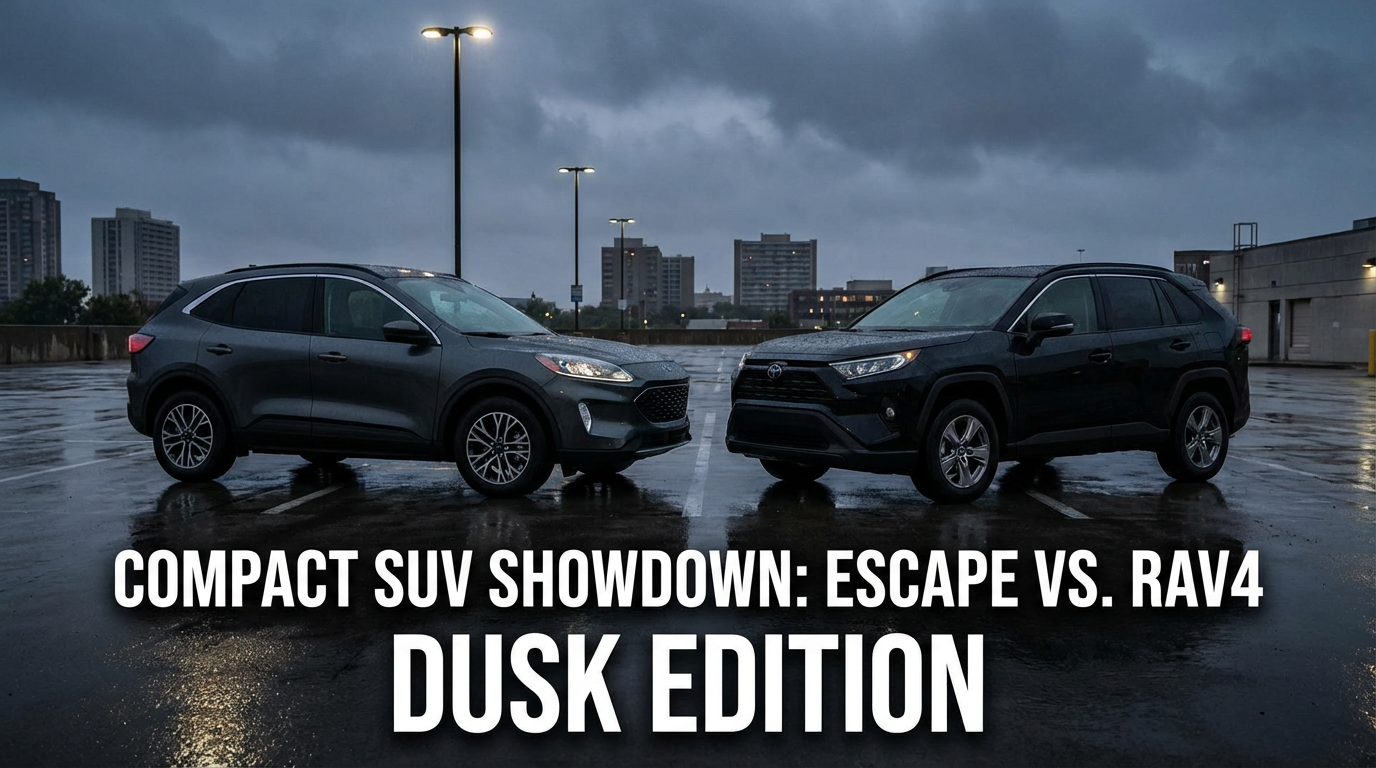
Before you sign that lease, you might want to see this. The Ford Escape — America’s third-best-selling compact SUV — kills at 0.95 deaths per 100 million vehicle miles traveled. The Toyota RAV4, the segment leader it competes against on every dealer lot in the country? 0.19. That’s a 5× gap between vehicles that sit in the same showroom price range.
The compact SUV is the most cross-shopped segment in America, and the safety spread within it is staggering. Here’s the full picture from FARS data:
| Vehicle | Deaths | Fleet | Rate | Impairment |
|---|---|---|---|---|
| Ford Escape | 2,284 | 1.93M | 0.95 | 18.5% |
| Honda CR-V | 2,072 | 3.15M | 0.53 | 17.6% |
| Subaru Outback | 707 | 1.27M | 0.45 | 19.7% |
| Chevy Equinox | 1,056 | 2.36M | 0.36 | 19.4% |
| Nissan Rogue | 968 | 2.19M | 0.35 | 19.0% |
| Hyundai Tucson | 669 | 1.58M | 0.34 | 17.6% |
| Subaru Forester | 396 | 1.23M | 0.26 | 20.5% |
| Toyota RAV4 | 914 | 3.76M | 0.19 | 18.4% |
| Mazda CX-5 | 162 | 1.05M | 0.12 | 19.8% |
Look at the impairment column. Every vehicle in this table clusters between 17% and 20%. This isn’t a behavior story. Nobody is driving the Ford Escape more recklessly than the Toyota RAV4. The demographics are nearly identical — suburban families, commuters, first-time SUV buyers. Same roads, same parking lots, same school drop-off lines. The impairment rates prove it.
So what’s killing Escape owners? Fleet age and engineering generations. The Escape’s FARS window captures the 2001–2012 first and second generations — vehicles that were still on the road through 2023 but designed to crash standards from two decades ago. The RAV4’s fleet skews heavily toward the 2013+ fifth generation, which earned IIHS Top Safety Pick+ and packed Toyota Safety Sense as standard. When you’re comparing “the Escape” to “the RAV4,” you’re often comparing a 2008 Escape on its third owner to a 2019 RAV4 still under warranty.
But fleet age alone doesn’t explain why the Escape is nearly 3× deadlier than the Equinox (0.36) or the Rogue (0.35) — vehicles with similar age profiles and price points. Ford’s early Escape generations had notably worse IIHS small-overlap front crash ratings than competitors. The math compounds: a marginal structural weakness, multiplied across 1.93 million vehicles and billions of miles, becomes 2,284 bodies.
The Mazda CX-5 — the segment’s smallest seller here — posts the best rate at 0.12. The two Japanese vehicles at the bottom of this table (RAV4 and CX-5) are 5–8× safer per mile than the American one at the top. That’s not a rounding error. That’s a canyon.
You’re not choosing between a sports car and a Volvo. You’re choosing between nearly identical vehicles at the same dealership, on the same test drive Saturday, for the same monthly payment. One of them is 5× more likely to put you in a FARS database. The sticker won’t mention it.