The Deadliest Speed Limit in America Is 45 MPH. It’s Posted on Every Suburban Boulevard You Drive.
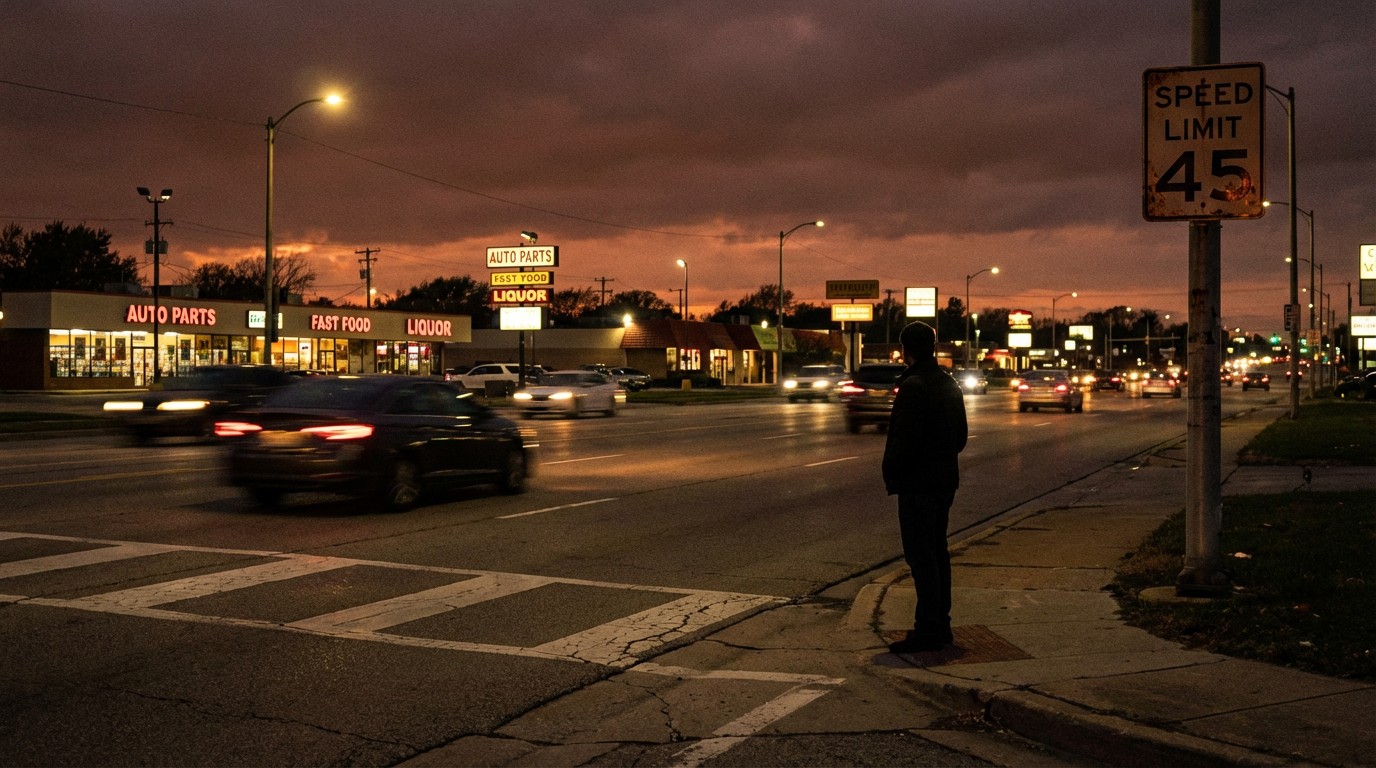
You know the road. Six lanes, painted center turn lane, Applebee's on one side and a Walgreens on the other. Speed limit: 45. Traffic doing 52. The crosswalk is 400 yards behind you but the bus stop is right here, so you cross anyway, because nobody drives to a bus stop.
This road has a name in urban planning circles. They call it a stroad. Half street, half road, fully good at being neither. And according to FARS data, 45 mph is the single most common posted speed limit where a driver strikes and kills a pedestrian or cyclist in America.
Not 65 on the interstate. Not 25 in a school zone. Forty-five. On the six-lane boulevard between the Taco Bell and the tire shop.
The Speed Nobody Survives
IIHS published updated pedestrian injury risk curves in 2024, building on crash data that researchers Monfort and colleagues assembled into the most granular speed-to-fatality dataset available for pedestrian impacts (IIHS Research ref #2322).
At 20 mph, a struck pedestrian has a 1% chance of dying.
At 35 mph, it's 19%.
At 42 mph, USDOT pegs the threshold at 50%. Half dead.
At 50 mph, the fatality rate exceeds 80%.
Read those numbers again. Going from 35 to 45 doesn't add 10 mph of risk. It crosses a threshold. Below 35, most people live. Above 45, most people don't. And 45 is what's painted on the sign of virtually every major arterial in suburban America.
Now factor in what Americans drive. IIHS data breaks out vehicle height: a median-height pickup truck striking a pedestrian at 35 mph produces a 91% serious injury rate, compared to 52% for a median-height car at the same speed. The United States fleet has shifted dramatically toward trucks and SUVs over the past 15 years. Taller front ends redirect impact energy from legs to torso and head.
Three Datasets, One Road
Three independent analyses converge on the same type of road killing the same type of person:
NHTSA FARS, via the League of American Bicyclists (2022 final file): When you sort pedestrian and cyclist fatalities by the posted speed limit of the road where the fatal strike occurred, 45 mph is the most common posted speed in urban areas. Not close. Sixty-five percent of pedestrian deaths with a reported speed limit happened on roads posted 40 mph or above. Sixty-two percent of cyclist deaths, same filter, same result.
Smart Growth America, Dangerous by Design 2024: Fifty-four percent of all pedestrian deaths in America happen on roads owned by state departments of transportation. States own just 20% of the road network by mileage. Arterials, stroads, boulevards. Roads designed for speed, lined with destinations that generate foot traffic. A fifth of the roads, more than half the bodies.
Strong Towns / Tennessee DOT Study (2022): Tennessee tracked a 117% increase in pedestrian fatalities from 2009 to 2019 and found the increase concentrated on "straight, multi-lane roads with speed limits over 35 mph in urban and suburban areas." The stroad description, stated plainly, by a state DOT that actually measured it.
All three analyses describe the same road. Wide. Fast. Lined with driveways and bus stops and strip malls and people who need to cross. Posted at 45.
What a Stroad Looks Like, Technically
Urban planners use "stroad" as shorthand, but the design characteristics are specific and measurable:
Multiple travel lanes in each direction, typically four to six total. No raised median. A painted center turn lane doing double duty as a left-turn reservoir and a de facto merge lane for driveway traffic. Driveways every 50 to 200 feet serving strip mall parcels, gas stations, fast food outlets. Bus stops positioned directly at the curb, with no pullout and no shelter, because transit was an afterthought in the road design. Crosswalks spaced a quarter-mile or more apart, guaranteeing that pedestrians will cross mid-block rather than walk ten minutes to use a signal. And traffic signals every 500 to 1,500 feet, which contradicts the entire premise of a 45 mph design speed.
The geometry tells drivers to go 50. The sign says 45. The land use puts people on foot in the same space. Crosswalks are too far apart to use. The result is predictable and predicted.
75% More Dead Since 2010
Pedestrian deaths in the United States were essentially flat from the mid-1990s through 2009, hovering around 4,000 to 4,500 per year. Then they started climbing. By 2022, the count reached 7,593. IIHS Fatality Facts logs 7,314 for 2023.
A 75% increase in a decade and a half. During a period when vehicle occupant fatality rates per mile driven were declining. Airbags, crumple zones, lane assist, automatic emergency braking. Cars got dramatically safer for the people inside them. Simultaneously, they got dramatically more lethal for everyone outside.
Smart Growth America tracked this divergence. Only 8 of 50 states saw any improvement in pedestrian death rates between 2013 and 2022. Nationally, the trend moved in one direction: up.
And the deaths are not distributed randomly. Black and American Indian/Alaska Native people are killed at disproportionately higher rates per capita. Stroads that generate these deaths tend to cut through lower-income neighborhoods where residents are more likely to walk, to use transit, and to cross arterials on foot because that's where the jobs and services are.
The Counterargument Is Actually the Point
Best objection to "lower the speed limit" is that it probably won't work on its own. And the objection is correct.
Research on driver compliance consistently shows that people drive the speed the road is designed for, not the speed the sign says. A six-lane arterial with 200-foot sight lines and gentle curves was engineered for 50-55 mph. Posting it at 45 doesn't make people drive 45. It just makes the posted speed limit a legal fiction and the people crossing the road the margin of error.
But this is an argument for the thesis, not against it. Road design is the problem. Speed limits are a symptom. The road tells drivers to go fast and pedestrians to exist in the same space. Then the crash report calls it an accident.
Cities that have actually changed the road, not just the sign, show the results. Hoboken, New Jersey, implemented an aggressive road diet: lane reductions, raised crosswalks, curb extensions, signal retiming. Pedestrian fatalities dropped from four per year to zero, and the zero held for seven consecutive years. New York City's Vision Zero program, using similar road diet interventions, reduced pedestrian fatalities 37% citywide, with larger reductions on redesigned corridors.
Remove a lane. Narrow what's left. Add a raised median. Install a mid-block crosswalk with a rectangular rapid-flashing beacon. These interventions cost a fraction of a road widening project and FHWA's Crash Modification Factor Clearinghouse documents 20-40% fatality reductions on treated corridors.
A 50x Multiplier with a $200 Fix
Consider the arithmetic. At 20 mph, 1% of struck pedestrians die. At 45 mph, roughly 50%. That's a 50x multiplier in fatality risk across a 25 mph increment. Every road diet that brings effective vehicle speeds from 45 down to 30 on a stroad corridor doesn't just trim risk. It drops below the lethality cliff.
A raised crosswalk costs $2,000 to $15,000 to install. A rectangular rapid-flashing beacon runs $4,500 to $52,000 depending on configuration. A painted curb extension is under $200 in materials. These are rounding errors in any state DOT budget. Tennessee alone spent $2.8 billion on highway construction in 2023.
And the 8,689 pedestrians and cyclists killed in 2022, that's 20% of all traffic fatalities, died overwhelmingly on roads where the geometry was the problem and the fix was known.
Not an Accident
Every state in the country has roads posted at 45 mph that carry pedestrian traffic through commercial corridors. Every traffic engineer who stamps the plans knows the fatality risk curve. Every DOT that declines to install a raised median or reduce a travel lane on a high-fatality arterial is making a choice.
Forty-five mph is the speed where half the people you hit die. It's the most common speed limit on the roads that kill the most pedestrians. And it's the posted limit on roads specifically designed to attract the kind of foot traffic that ends up in the crosshairs.
We didn't stumble into this. We engineered it, posted a sign, and kept building strip malls.
Methodology note: Fatality data from NHTSA's Fatality Analysis Reporting System (FARS), 2022 final file. Speed limit distribution from League of American Bicyclists analysis of FARS striking-vehicle data. Pedestrian injury risk curves from IIHS (Monfort et al., 2024, ref #2322). Infrastructure data from Smart Growth America, Dangerous by Design 2024 report. Tennessee pedestrian fatality analysis from Strong Towns / Tennessee DOT (2022). Cost-benefit estimates from FHWA Crash Modification Factor Clearinghouse and state DOT construction budgets. Road diet effectiveness data from FHWA and municipal program evaluations. FARS captures only fatal crashes; speed limit data reflects posted limits, not measured vehicle speeds, which are typically higher. Pedestrian exposure data (how many pedestrians are actually present on each road type) is not uniformly collected nationally, introducing uncertainty into per-exposure fatality rates.