The Crash Report
Every fatal crash in America, charted.
Data from NHTSA FARS 2014–2023 bulk CSV. Covers ALL occupant fatalities in vehicles involved in fatal crashes, all model years on the road. Estimated rates use sales-based fleet estimates × NHTS class-average annual miles—see Methodology for caveats.
| ☐ | # ▲▼ | Vehicle ▲▼ | Class ▲▼ | 5yr Deaths ▲▼ | Annual Avg ▲▼ | Est. Fleet ▲▼ | Est. Rate ▲▼ |
|---|
Impairment defined as BAC > 0 (alcohol) or specific drug detected in toxicology (drugs). Testing rates vary significantly by state and jurisdiction — actual impairment rates may be higher than reported. Models with 100+ drivers in fatal crashes shown.
| ☐ | # ▲▼ | Vehicle ▲▼ | Class ▲▼ | Drivers ▲▼ | Any % ▲▼ | Any # ▲▼ | Alc % ▲▼ | Alc # ▲▼ | Drug % ▲▼ | Drug # ▲▼ |
|---|
Shows total occupant deaths by vehicle model year across FARS 2014–2023 data. Older model years have more cumulative years of exposure on the road; this chart reflects fleet-age composition, not inherent vehicle safety differences. Select up to 5 vehicles to compare.
2024 data is an early NHTSA estimate subject to revision. Bars show total fatalities (left axis); line shows rate per 100M VMT (right axis).
Rates calculated from NHTSA FARS fatality counts and FHWA VM-1 vehicle miles traveled. Per-model VMT is not publicly available; these rates apply at the broad vehicle-class level only.
The Chevy Tahoe Weighs 5,600 Pounds. It Didn't Help.
At 2.49 deaths per 100M VMT, the Tahoe is deadlier per mile than a Honda Civic — despite weighing nearly twice as much. The Silverado shares its platform and kills at half the rate. Size isn't safety.
Mercury Died in 2011. The Grand Marquis Is Still Killing People.
Three Ford Panther platform cars, same bones, wildly different fates. The Grand Marquis kills at 2.29 per 100M VMT — 2.7× deadlier than the Town Car (0.86). Same frame, same engine. The difference is who bought them.
The Jeep Cherokee Is 3.4× Deadlier Than the Grand Cherokee. The Name Is a Trap.
2,276 deaths at 1.73 per 100M VMT from a 1.05M fleet — while the Grand Cherokee’s 1.84M fleet manages just 0.51. Same brand, same name, 3.4× the death rate. Cherokee drivers are more sober too.
The Ford Ranger Is Nearly 3× Deadlier Than the F-150. Small Trucks Are a Lie.
3,089 deaths at 2.91 per 100M VMT. Every compact truck in FARS is deadlier per mile than its full-size counterpart — S-10 at 4.83 vs Silverado at 1.25, Dakota at 2.62 vs Ram at 0.78. Smaller doesn’t mean safer.
The Nissan Sentra Is the Cheapest Way to Die in a Sedan
2,571 deaths at 2.13 per 100M VMT — deadlier than the Corolla, Elantra, and Cruze. The Sentra is 3.4× more lethal per mile than the Cruze, and its own sibling Versa is somehow half as deadly.
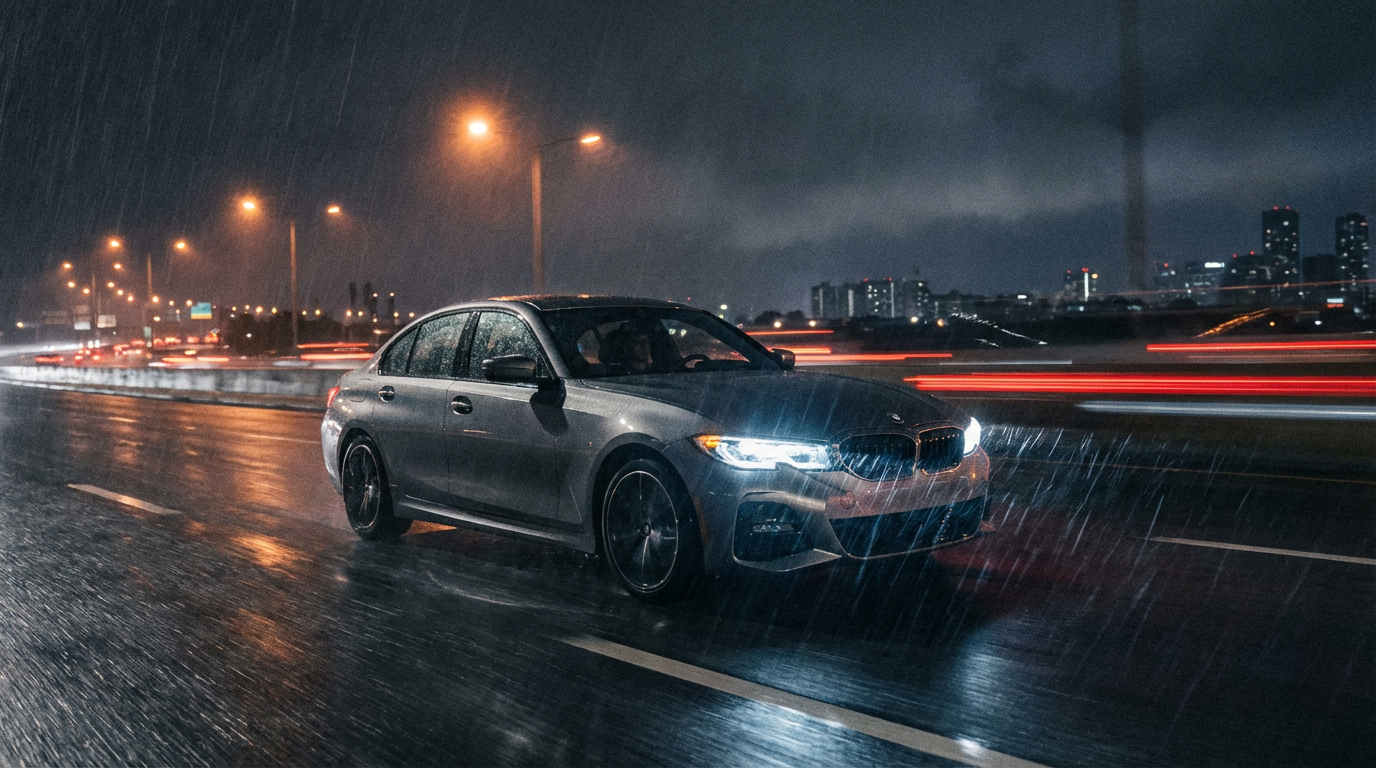
The BMW 3 Series Is the Deadliest Luxury Car in America. By a Lot.
At 2.73 deaths per 100M VMT, the “Ultimate Driving Machine” is 8.5× deadlier than the Audi A4. Its 1,237 fatalities dwarf every luxury competitor, and 22.1% of its drivers in fatal crashes were impaired.
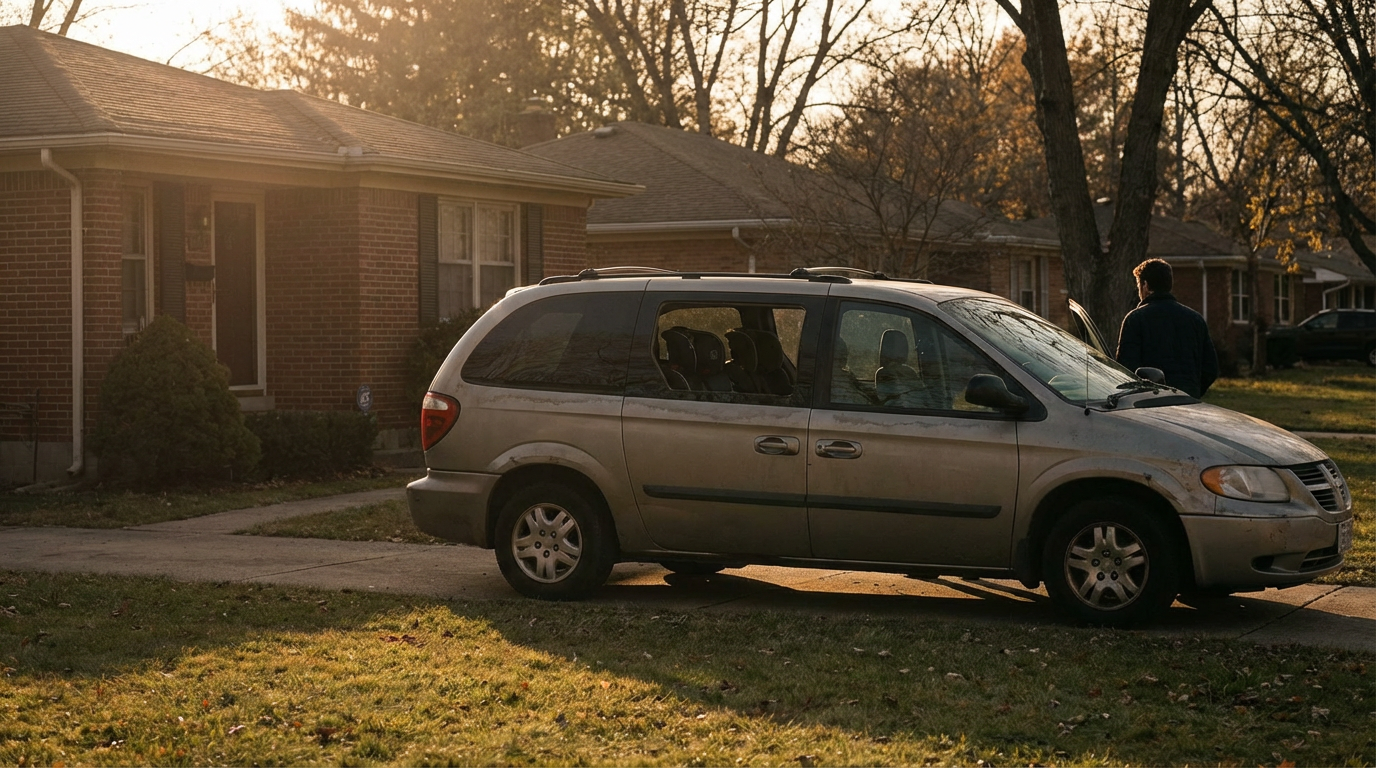
The Dodge Grand Caravan Killed 1,782 People. Almost None of Them Were Drunk.
America’s default family hauler has the lowest impairment rate in FARS at 15.3%. Its 1,782 deaths are overwhelmingly sober parents on routine trips.
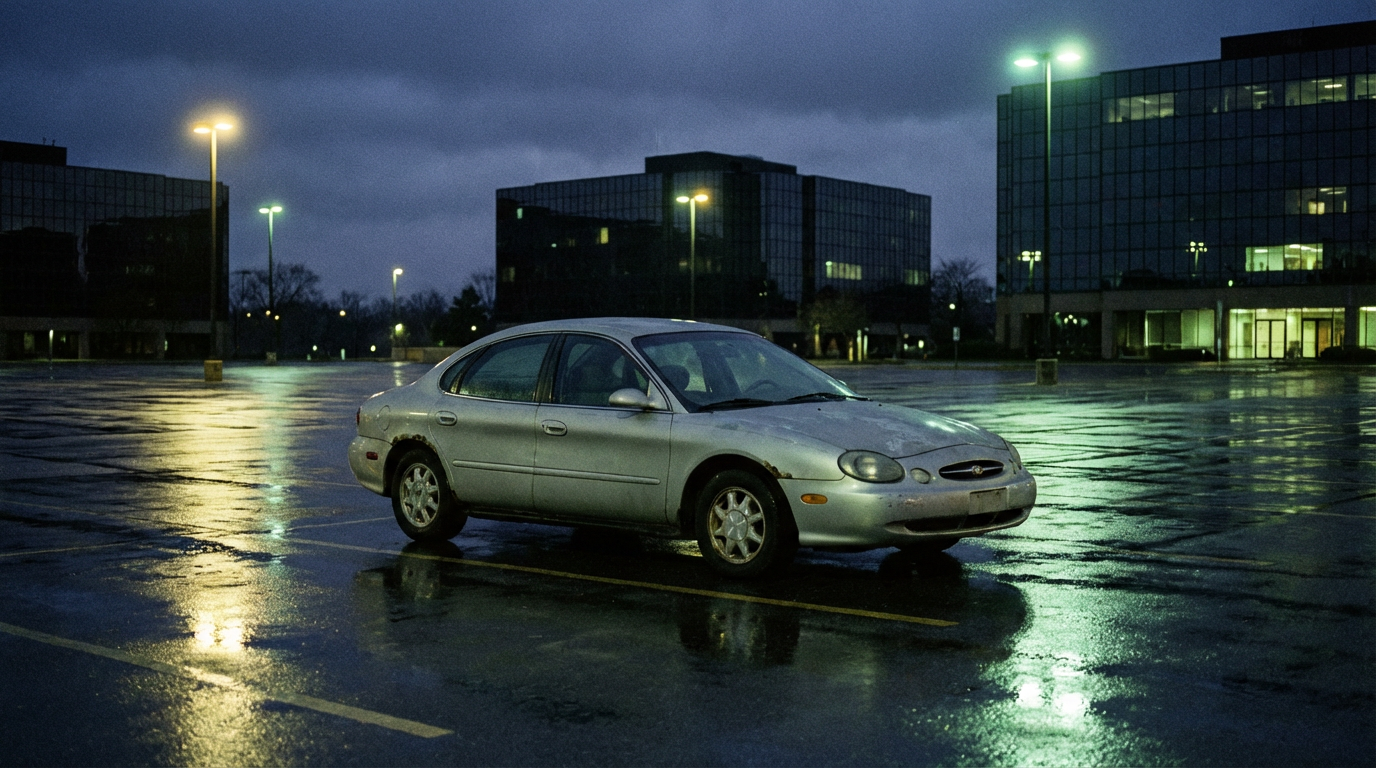
The Ford Taurus Was America’s Best-Selling Car. Then It Became a Ghost.
Once the best-selling car in the country, the Taurus ended its life as a fleet-only rental sedan. Its 2.74 per-mile death rate is more than double the Fusion that replaced it.
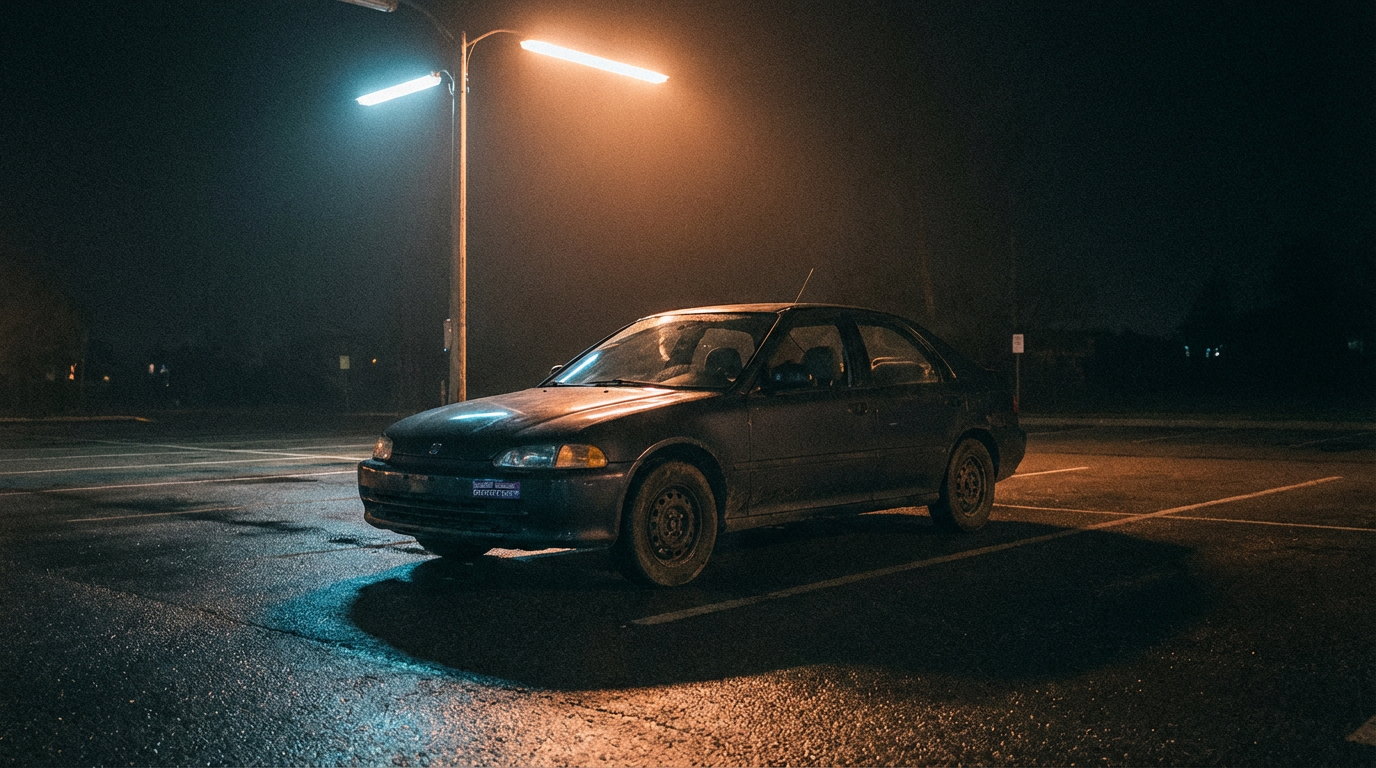
The Honda Civic Has Killed 6,553 People. It’s Still Everyone’s First Recommendation.
The safest car in the world can still be one of the deadliest — if enough people drive it. The Civic’s 2.25 per-mile rate beats every compact rival.
The Toyota Camry Is the ‘Safest’ Car in America. It Has Killed 6,328 People.
Below-average fatality rate, 5th highest body count. The paradox of safe cars that kill thousands through sheer ubiquity.
‘Altima Energy’ Is Real. 4,787 People Are Dead.
The internet meme about reckless Altima drivers is backed by hard FARS data — 7th deadliest vehicle in America with a 2.88 fatality rate. But the impairment rate is surprisingly average.

The Dodge Charger Is America’s Favorite Bar Car. The Toxicology Reports Prove It.
Of 4,339 Charger drivers in fatal crashes, 985 were impaired — a 22.7% rate. It’s a “sedan” with a Hemi V8 and a customer base that skews thirsty.
March 9, 2026
The Ford Focus Was America’s Most Popular First Car. It Killed 3,046 People.
At 2.52 per 100M VMT, the Focus was deadlier per mile than every compact competitor — Civic, Corolla, Elantra. And 80% of fatal crashes were sober.
The Chevy Cobalt Was a Death Trap Before GM Even Admitted It
At 5.10 deaths per 100M VMT, the Cobalt is the deadliest compact sedan in the database. Its replacement, the Cruze, is 8× safer. The ignition switch scandal was just the beginning.

The Camaro Is the Second-Deadliest Sports Car in America. It’s Not Even Close to First.
At 3.44 deaths per 100M VMT, the Camaro kills at half the Mustang’s rate — but with a higher impairment percentage. 1,204 dead in a decade.
Nissan’s “Luxury” Sedan Is Twice as Deadly as the Altima
At 5.11 deaths per 100M VMT, the Maxima is nearly 2× deadlier than the Altima — and it’s not even a sports car.
Pickup Trucks Account for 1 in 5 Traffic Deaths in America
41,593 pickup fatalities over a decade. The Silverado alone tops the entire database at 9,591. But per mile, they’re safer than sedans.
The Chevrolet Impala: America’s Deadliest Rental Car
At 5.0 deaths per 100M VMT and 3,774 fatalities, the fleet-favorite Impala is 2.5× deadlier than its own sibling, the Malibu.
The Ford Mustang Has the Highest Death Rate of Any Mass-Market Car in America
At 6.02 deaths per 100M VMT and 2,739 fatalities, the Mustang is the deadliest mainstream vehicle on American roads.
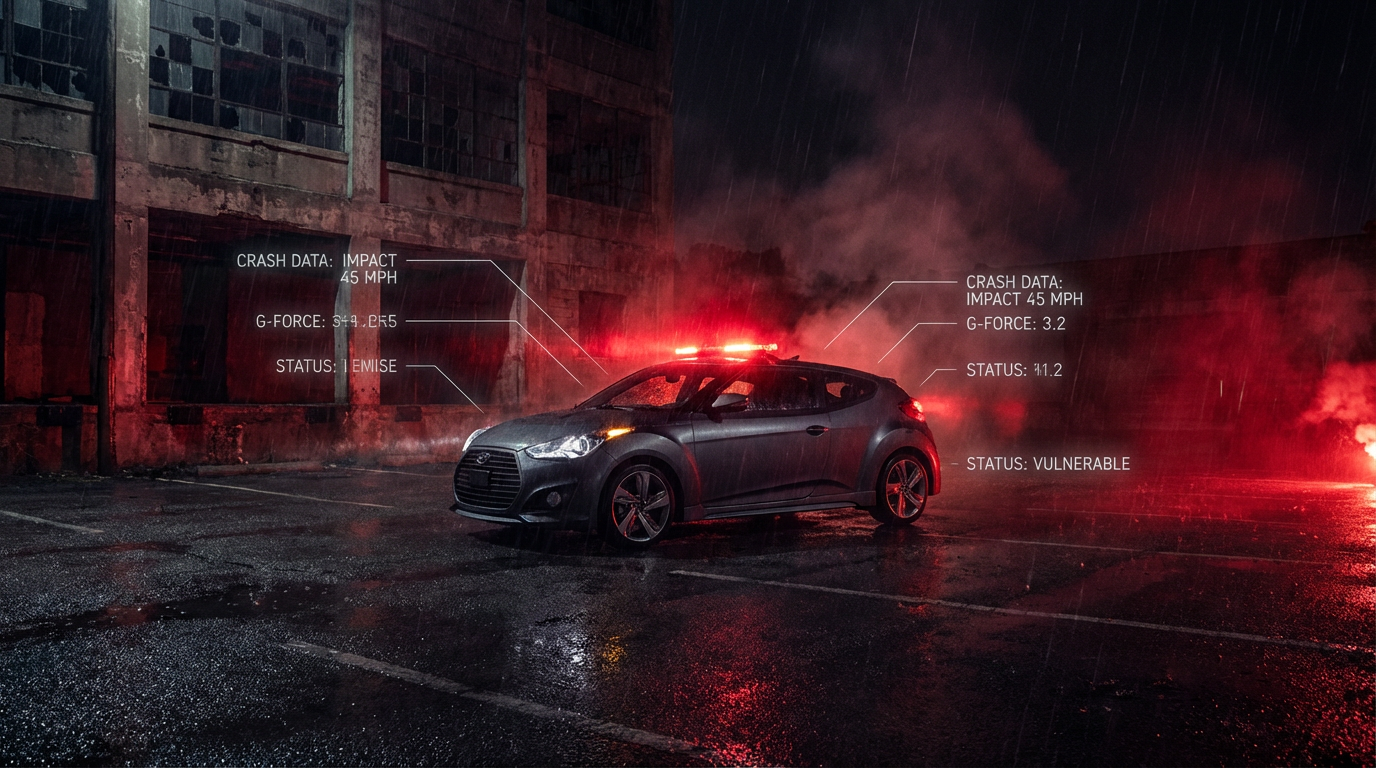
The Hyundai Veloster Is the Deadliest Car in America Per Mile Driven
At 8.54 deaths per 100M VMT, this economy coupe out-kills the Mustang, Camaro, and Corvette — and its drivers are comparatively sober.

The Tesla Paradox: Silicon Valley’s Safety Darling Meets the Muscle Car’s Worst Habit
Model Y posts 0.03 deaths per 100M VMT. Model S posts a 24% impairment rate. Same brand, different species.
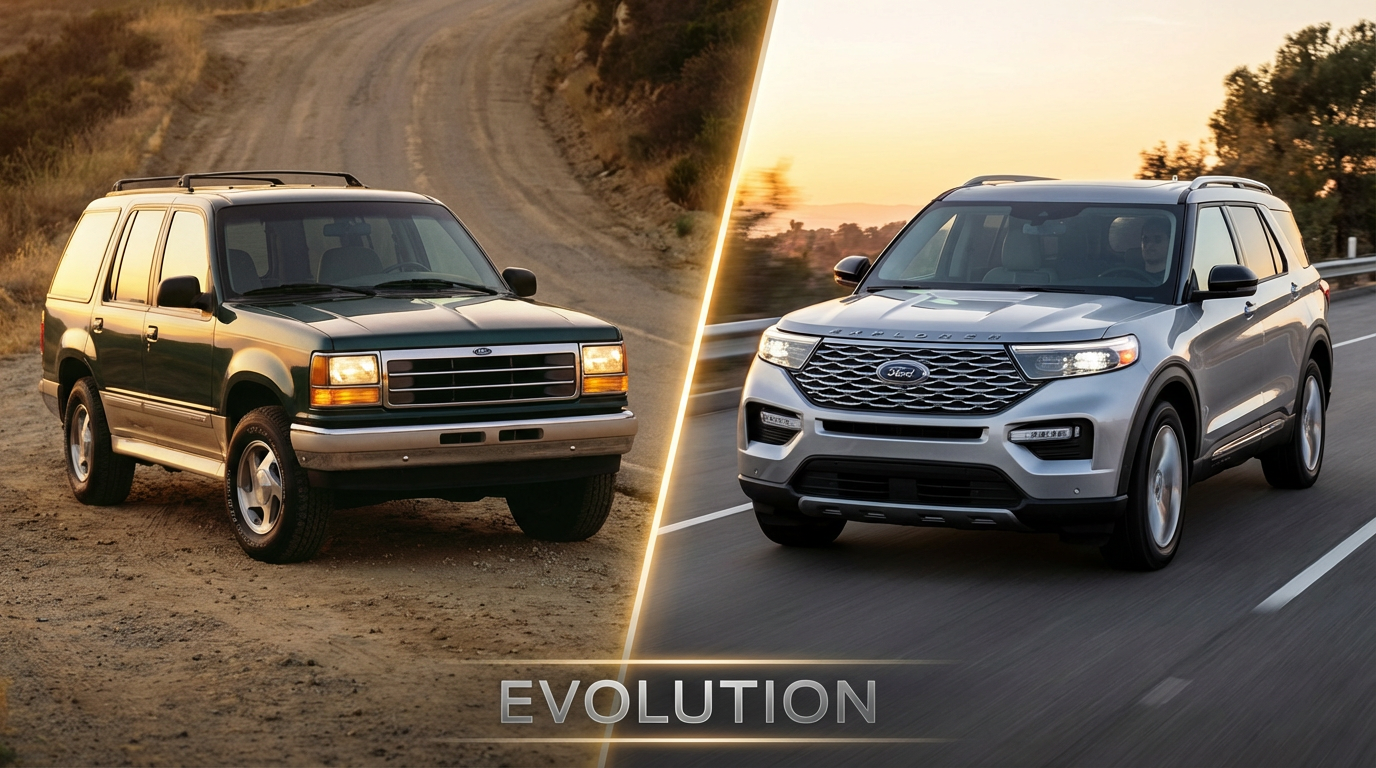
How the Ford Explorer Escaped Its Own Legacy
503 fatal crash involvements for the 2002 model year. 8 for the 2022. A 98.4% reduction.

One In Four Corvette Drivers In Fatal Crashes Is Impaired
26.2% tested positive for alcohol or drugs — the highest of any major sports car. The Buick Park Avenue hits 31.7%.
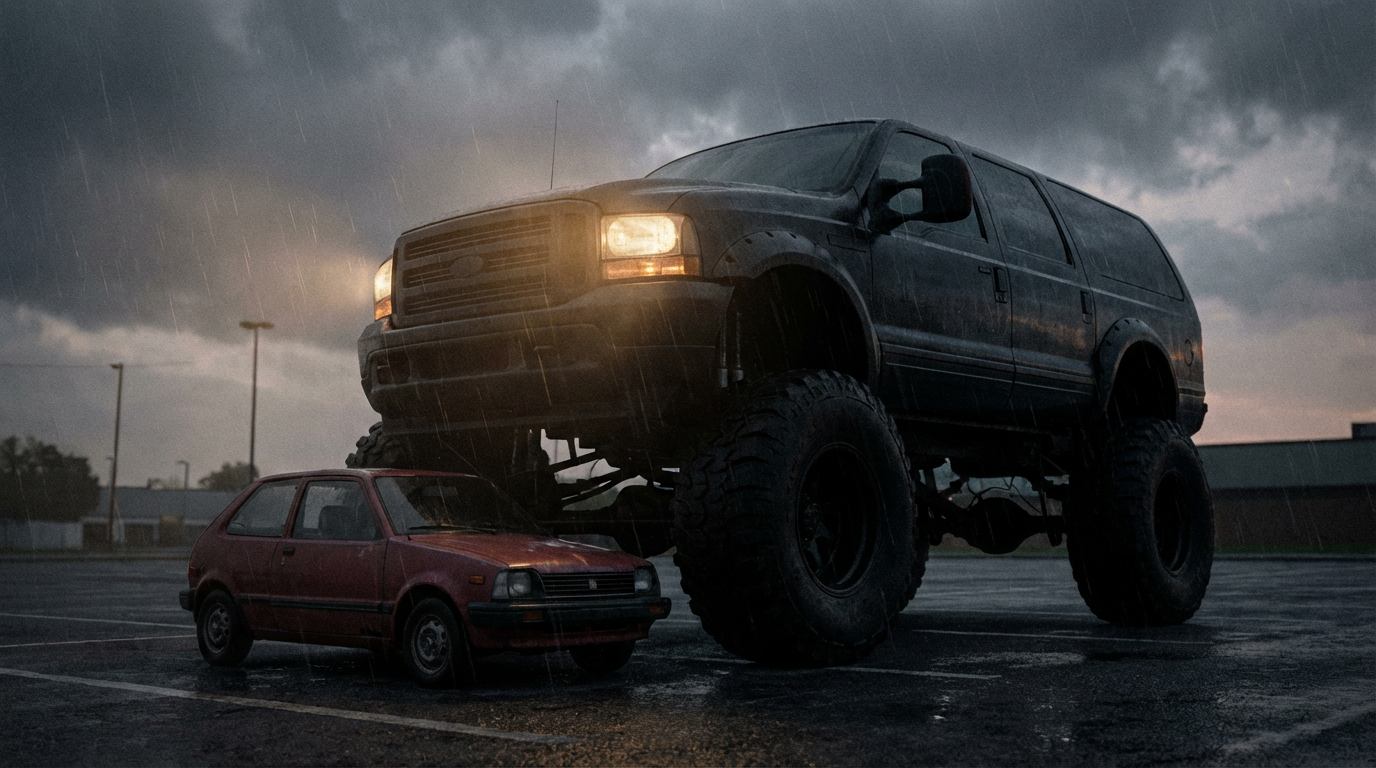
The 261x Death Gap: How Your SUV Choice Is a Life-or-Death Decision
The fatality rate gap between the Chevrolet Tracker and the Porsche Macan is 261-fold.
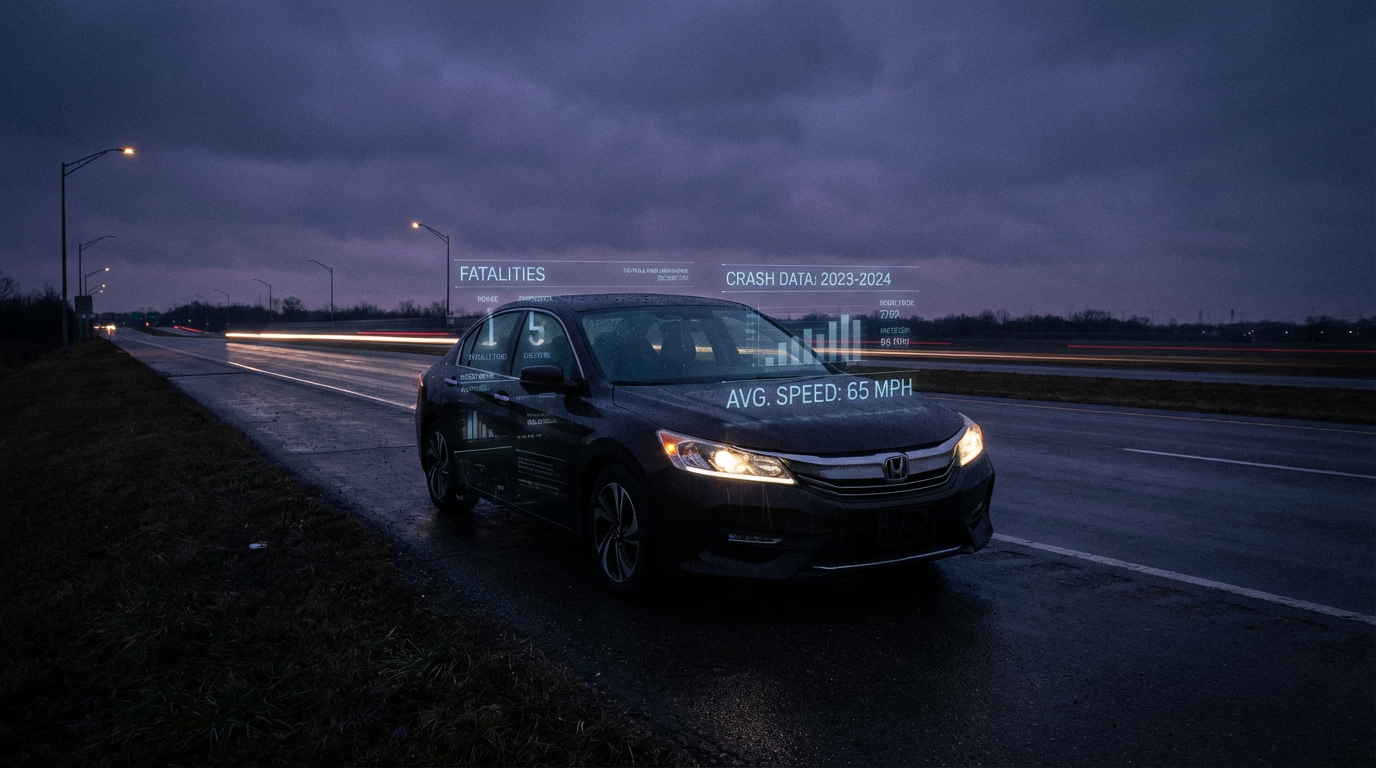
The Honda Accord Has Killed More People Than the Mustang, Camaro, Corvette, and Challenger Combined
7,102 Accord deaths vs. 4,648 for all four muscle cars. Ubiquity is its own kind of danger.

The Chevy Astro Van: Where 27% of Drivers in Fatal Crashes Were Loaded
A minivan out-drinks the Mustang. Impairment correlates with vehicle price, not vehicle type.
The Toyota Land Cruiser Paradox: Sober Drivers, Maximum Death
3rd-lowest impairment rate. 3rd-highest death rate. The most unsettling data point in the database.
AI-generated editorial analysis of NHTSA FARS public data. See Methodology for caveats.
NHTSA FARS national data
The Fatality Analysis Reporting System (FARS) is a census of all fatal motor vehicle crashes in the United States, maintained by NHTSA. FARS covers all crashes nationally and can be normalized by vehicle miles traveled (VMT) — but only at the broad vehicle-class level (passenger cars, light trucks, motorcycles), not per make/model.
VMT data comes from the FHWA Highway Statistics Table VM-1, which estimates total miles driven annually by vehicle type. Dividing FARS fatalities by VMT yields the "fatality rate per 100 million VMT" — the standard metric used in NHTSA Traffic Safety Facts publications.
- 2024 data is an early estimate based on NHTSA's preliminary projections and is subject to revision.
- Fatalities by road user type (2014–2023) are final FARS counts.
- Per-class VMT rates use FHWA VM-1 data matched to FARS occupant fatality counts for the corresponding vehicle type.
FARS per-model estimated rates
The FARS per-model section aggregates all occupant fatalities across 2014–2023 from NHTSA FARS bulk CSV downloads, grouped by make/model. This data includes:
- All occupant fatalities (drivers + passengers), not just driver deaths
- All model years on the road, not a single MY cohort
- All vehicles involved in fatal crashes, regardless of registration volume
Since per-model VMT data does not exist publicly, estimated fatality rates use a proxy method:
- Fleet estimate: publicly reported average annual US sales × fleet multiplier (12.5 yr average vehicle age × 0.70 survival discount ≈ 8.75 effective fleet years)
- Annual VMT estimate: estimated fleet × NHTS class-average annual miles (sedans: 11,500 mi; SUVs: 12,500 mi; pickups: 13,500 mi; vans: 11,800 mi; sports cars: 8,000 mi)
- Rate: 10-year total deaths ÷ (estimated annual VMT × 10 years ÷ 100,000,000)
Key caveats:
- Sales figures ≠ registrations — fleet size estimates are approximate
- All vehicles within a class are assumed to drive the same annual miles
- Does not account for driver demographics, geographic variation, or vehicle age distribution
- Includes models with 50+ deaths or significant annual sales (>1k) for rate comparison
Impaired driving analysis
Impairment data comes from the FARS PERSON.csv file, filtered to drivers only (PER_TYP = 1). Each driver record is joined to its vehicle record via ST_CASE and VEH_NO.
- Alcohol positive: DRINKING = 1 (police-reported) OR ALC_RES (BAC test result) between 1–94 (BAC > 0.00 g/dL)
- Drug positive: DRUGRES1/2/3 values 100–295 (specific drug detected in toxicology) OR DRUGS = 1 in older files
- Any impairment: alcohol positive OR drug positive
Key caveats:
- Toxicology testing rates vary significantly by state and jurisdiction — some states test nearly all fatally-involved drivers, others test far fewer
- Untested drivers are coded as unknown, not negative — actual impairment rates are likely higher than reported
- Only models with 100+ drivers in fatal crashes are shown to ensure statistical significance
Model year analysis
The MOD_YEAR field from FARS VEHICLE.csv identifies the model year of each vehicle involved in a fatal crash. Deaths are aggregated by (make, model, model year) across the 2014–2023 observation period.
- Older model years have more cumulative years of exposure on the road during the observation period, creating a natural age-related skew
- This chart reflects fleet-age composition and crash involvement, not inherent safety differences between model years
- Model years with fewer than 5 deaths are excluded
- Invalid model year values (0, 9998, 9999, pre-1980, or future years) are excluded
Scope: fatalities only
This dashboard covers fatal crashes only from the FARS census. NHTSA also maintains the Crash Report Sampling System (CRSS), which covers all police-reported crashes (including injuries and property damage) — but CRSS is a probability-based sample, not a census, and is not incorporated here.
Limitations
- NHTSA/FARS data: VMT normalization is only available at the vehicle-class level, not per make/model. Class-level rates mask variation within each category.
- FHWA VMT estimates are modeled from traffic counts and may not perfectly reflect actual travel.
- FARS per-model: Estimated rates depend on sales-as-fleet-proxy assumption. Vehicles with much higher or lower than average usage will have distorted rates.
Sources
NHTSA FARS database → |
NHTSA Traffic Safety Facts →
FHWA Table VM-1 →
FARS bulk CSV downloads → |
NHTS (National Household Travel Survey) →
FARS/CRSS Coding and Validation Manual →