7,314 Pedestrians Died in 2023. America’s Roads Were Designed to Kill Them.
In the first 150 milliseconds of impact between a 5,500-pound SUV and a human body at 40 miles per hour, the pedestrian’s legs fracture below the knee. The hood’s leading edge, now 49 inches off the ground on a modern pickup, catches the torso above the center of mass. Instead of rolling onto the hood and windshield as crash physics intended when hoods were 30 inches high, the body folds forward and goes under or gets launched. Its head strikes either the hood at full closing speed or the pavement. Survival probability at this point is roughly 50%.
At 50 mph, it’s roughly 10%.
Those are the physics of a single collision. America produces 7,314 of them per year. What makes the number climb isn’t driver behavior or pedestrian recklessness. It’s a three-blade machine built into the infrastructure itself: roads designed for darkness, built without sidewalks, and filled with vehicles that turn survivable impacts into fatal ones.
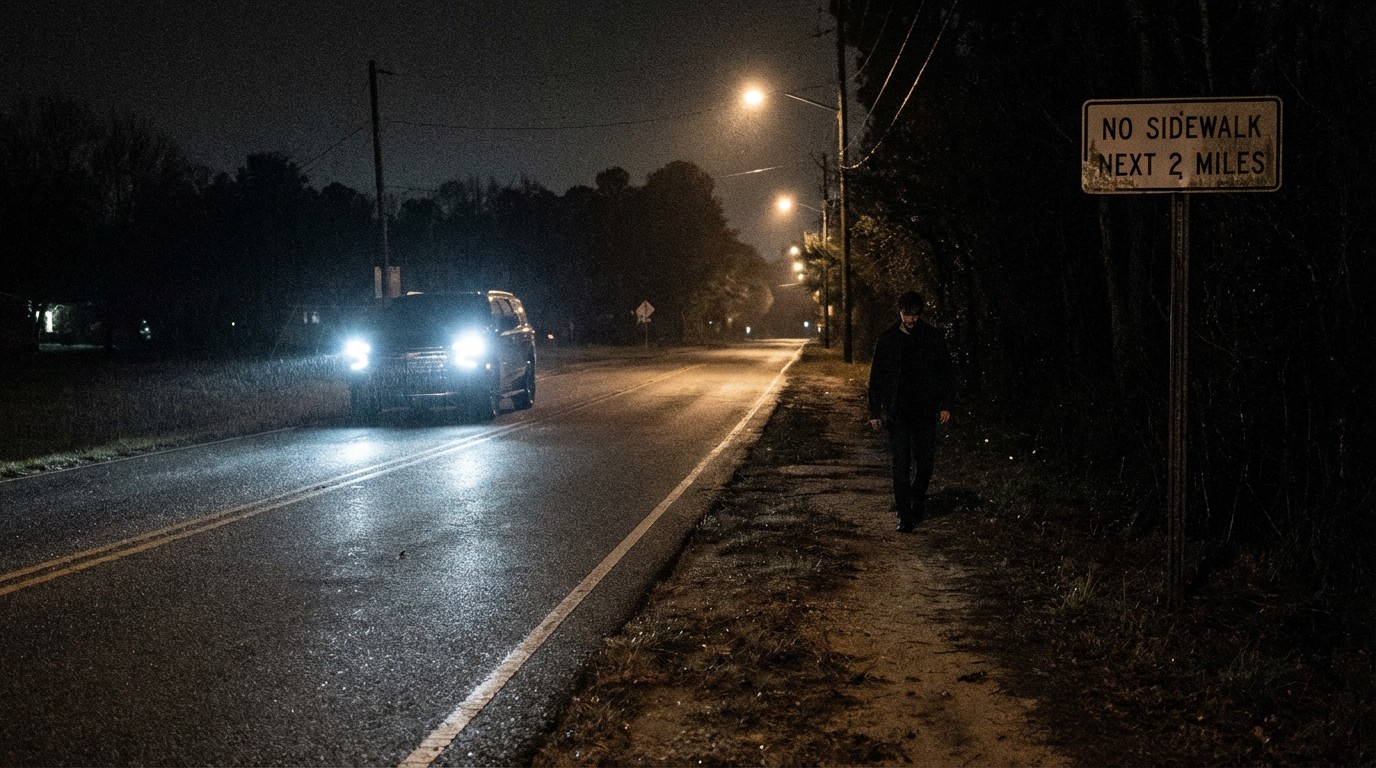
Blade one: darkness
Seventy-six percent of pedestrian fatalities in 2023 occurred after dark.[2] That number, by itself, tells a story about road lighting in America. But the trend tells a worse one.
| Condition | Deaths 2010 | Deaths 2023 | Change |
|---|---|---|---|
| Dark | 3,030 | 5,578 | +84% |
| Daylight | 1,092 | 1,396 | +28% |
Nighttime pedestrian deaths nearly doubled in 13 years. Daytime deaths rose 28%. That gap is widening, not closing. If you wanted to design a graph that screams “the problem is lighting infrastructure,” you could not improve on this one.
Speed plays into the darkness blade directly. Drivers on unlit arterials routinely travel 45-55 mph. At those speeds, headlights illuminate about 350 feet of road. A pedestrian in dark clothing is visible at roughly 55 feet. At 50 mph, 55 feet of stopping distance takes 0.75 seconds. Average driver reaction time is 1.5 seconds. Do the math: the pedestrian is invisible until the point of no return has already passed.
Blade two: no sidewalk
Sixty-five percent of pedestrian deaths in 2023 occurred in locations where no sidewalk existed.[2] Since 2017, pedestrian fatalities in places without sidewalks rose by 1,164. In locations with sidewalks, the increase was 167.
Locations without sidewalks account for roughly seven times the fatality increase.
Seventy-six percent of all pedestrian deaths occur away from intersections.[1] This gets coded as “jaywalking” in crash reports, which frames a systems failure as individual fault. When the nearest marked crosswalk is half a mile away on a road designed for 50 mph traffic, people cross where they are. They always have and always will. Road engineers who designed the five-lane arterial with no crossings for 2,600 feet guaranteed this outcome.
Federal Highway Administration data classifies these roads as “stroads” when they try to function as both high-speed thoroughfares and commercial access streets. Speed limits of 45-55 mph. Strip-mall driveways every 200 feet. No medians, no refuge islands, no safe crossing infrastructure. Strong Towns estimates stroads account for roughly 60% of all pedestrian fatalities in America, though that figure is based on FHWA road-classification data, not a peer-reviewed analysis.[7] Regardless of the exact share, they are the default arterial design in nearly every American suburb built after 1950.
Blade three: the vehicle
Light trucks (SUVs, pickups, and vans) accounted for 54% of pedestrian fatalities in 2023 where vehicle type was known.[1] A decade ago, passenger cars and light trucks were roughly equal. That divergence tracks directly with the shift in the US vehicle fleet toward larger, taller machines.
We covered the hood-height problem in detail in a previous investigation. Short version: vehicles with hood heights above 40 inches are 45% more likely to cause pedestrian fatalities than those below.[3] That’s not a subtle statistical signal. It’s a design choice that kills people.
This piece is about the system, not the vehicle. But the vehicle blade is sharpening every year. An average new truck sold in America in 2024 weighs 5,340 pounds and has a hood line at or above 48 inches. Those aren’t anomalies. They’re the bestselling vehicles in the country.
The convergence math
Each blade is dangerous alone. Together, they compound. Speed-fatality curves for pedestrians are exponential, not linear:
| Impact Speed | Fatality Probability |
|---|---|
| 20 mph | ~2.5% |
| 30 mph | ~10% |
| 40 mph | ~50% |
| 50 mph | ~90% |
A pedestrian walking along a dark stroad at night, no sidewalk, where a pickup traveling 45 mph fails to see them: the three blades converge. Darkness eliminates visibility. Missing sidewalks force the pedestrian into the travel lane or shoulder. Vehicle height ensures the impact geometry maximizes lethality. Combined survival probability is in the range of 10-15%.
At 20 mph on a lit street with a sidewalk, the same pedestrian walks home. That difference isn’t behavior. It’s road design.
The safety net with a hole in the middle
Pedestrian automatic emergency braking was supposed to fix this. IIHS published data in 2022 showing pedestrian AEB reduces crashes by 27% overall.[4] NHTSA mandated it for all new vehicles starting 2029. Good news, on paper.
Then IIHS published the fine print.
On dark roads, the effect of pedestrian AEB on crash risk is “negligible.”[4]
Seventy-six percent of pedestrian deaths happen in the dark. America’s single most important active safety technology for pedestrians does not work when three quarters of pedestrians die. A safety net with a hole exactly where the floor drops out.
IIHS tested high-visibility clothing in 2025 and found it actually confuses pedestrian AEB sensors.[4] Safety advice everyone gives pedestrians — wear bright colors, be visible — may actively interfere with the technology that’s supposed to detect them. Camera-based AEB systems trained on pedestrian silhouettes against dark backgrounds misclassify high-contrast clothing as non-pedestrian objects. AEB was optimized for a scenario that accounts for 24% of pedestrian deaths.
The demographic blade nobody talks about
Black Americans have a pedestrian death rate 118% higher than non-Hispanic white Americans.[5] American Indian and Alaska Native pedestrians die at 3.42 times the rate of white pedestrians.[6]
This isn’t about behavior. It’s about infrastructure distribution. Low-income neighborhoods are statistically less likely to have sidewalks, marked crosswalks, pedestrian signals, street lighting, and lower-speed road designs. All three blades cut hardest in the communities that can least afford alternatives to walking.
When 65% of pedestrian deaths occur where no sidewalk exists, and sidewalk construction patterns track with property values and municipal tax bases, pedestrian deaths are not a traffic safety issue. They are an infrastructure equity issue that kills 7,314 people a year and is distributed along racial and economic lines.
Hit-and-run: the driver who keeps going
One in four pedestrian deaths in 2023 was a hit-and-run.[2] That’s 1,818 people killed by someone who drove away.
Pre-2020, the hit-and-run share was roughly 20%. It climbed to 25% and has stayed there. In 94% of fatal hit-and-runs, the striking vehicle was the fleeing vehicle. These aren’t complex multi-vehicle pileups where fault is ambiguous. Someone hit a pedestrian and left.
Darkness amplifies this blade. Most hit-and-runs happen at night on roads without lighting. Drivers may not have seen the pedestrian. They may not know they hit a person. Or they may know and leave anyway. Regardless, the crash occurs in conditions where witnesses are scarce, cameras are absent, and the road design itself provides no evidence trail. Three blades, one outcome: pedestrians die, and drivers disappear.
The pedestrian responsibility objection
An honest counterargument: pedestrians bear some responsibility. Twenty-nine percent of pedestrians killed in 2023 had a blood alcohol concentration of 0.08 or higher.[1] Impaired pedestrians make dangerous decisions. That’s real data, and pretending it doesn’t exist would be dishonest.
But context matters. Sixty-five percent of those deaths occurred where no sidewalk existed. They didn’t choose to walk without infrastructure. No infrastructure exists. Seventy percent of killed pedestrians are male, a figure unchanged since 1975.[1] Behavioral patterns are real. Roads amplify them into fatalities.
And driver behavior cuts both ways. Sixteen percent of fatal pedestrian crashes involved a driver with BAC of 0.08 or higher.[1] Pedestrians get coded as the problem. Infrastructure that created the exposure gets none of the blame.
Even the term “jaywalking” is an automotive industry invention from the 1920s, manufactured by car companies to shift liability from drivers to pedestrians. A century later, crash reports still use the framing.
The freeway pedestrians
Roughly 1,200 people died on freeways and interstates in 2023 in circumstances coded as “pedestrian” crashes.[1] These are stranded motorists changing tires. First responders at crash scenes. Tow truck drivers doing their jobs. People whose car broke down on a road with no shoulder, no lighting, and 70 mph traffic.
Every state has a Move Over law. Nearly unenforceable. A highway patrol officer cannot be behind every stranded vehicle on every interstate. Road design assumes pedestrians never exist on these roads, so when they do, nothing protects them.
What closing the blades looks like
None of this is theoretical. Sweden, which pioneered Vision Zero in 1997, has a pedestrian fatality rate roughly one-fifth of the US rate per capita. Swedish roads aren’t safer because Swedish pedestrians behave better. They’re safer because Swedish road design separates pedestrians from fast traffic, lights arterial crossings, and defaults to 30 km/h (19 mph) in urban areas. Three blades, closed by design.
None of this requires new technology:
- Street lighting on arterials. Nighttime pedestrian deaths doubled while daytime rose 28%. Light the roads where people die.
- Sidewalks on stroads. 65% of deaths occur where no sidewalk exists. Build sidewalks or lower speeds to 25 mph. Pick one.
- Speed reduction on mixed-use roads. At 20 mph, pedestrian fatality probability is 2.5%. At 40 mph, it’s 50%. That difference is a speed limit sign and some road design.
- Fix AEB at night. If the safety technology can’t see pedestrians in the dark, it’s not pedestrian safety technology. NHTSA’s 2029 mandate should include nighttime performance standards.
- Vehicle design standards. Hood height regulation would reduce the 45% lethality increase from tall front ends. No manufacturer will do this voluntarily when trucks outsell cars 2-to-1.
Every blade is someone else’s problem. Lighting is a municipal budget issue. Sidewalks are a land-use planning issue. Vehicle height is a NHTSA issue. AEB performance is a manufacturer issue. Nobody owns the convergence. So 7,314 people die every year at the intersection of three failures that three different institutions are responsible for and none of them are fixing.
Methodology and limitations
Pedestrian fatality counts, alcohol involvement, and gender/location breakdowns come from NHTSA FARS data via IIHS compilations (2023). FARS captures only crashes resulting in death within 30 days; non-fatal pedestrian injuries (estimated at 60,000+ annually) are not reflected.
Darkness share (76%) and no-sidewalk share (65%) come from the GHSA 2025 pedestrian report using 2023 and 2024 preliminary data. Nighttime doubling comparison uses 2010-2023 FARS data. Speed-fatality probability curves come from pooled international studies (Tefft, AAA Foundation 2013) and may vary by vehicle type, pedestrian age, and impact angle.
IIHS data shows light trucks at 54% of pedestrian fatalities where vehicle type was known; roughly 15% of fatal pedestrian crashes involve unknown vehicle types, particularly hit-and-runs, which may skew the distribution. Racial disparity data comes from SafeTREC (2025) and NHTSA (2022) and uses different denominators (population vs. VMT vs. walking trips), each of which produces different disparity ratios.
“Three-blade” is a structuring metaphor for three independently documented risk factors. FARS does not publish a cross-tabulation of darkness × sidewalk presence × vehicle type for the same crash, so the convergence probability is estimated from independent rates rather than measured directly. If the factors are correlated (dark roads are also more likely to lack sidewalks), the independent-rate estimate may overstate the compounding effect. A FARS microdata query could produce the actual overlap, and should be done.
Stroad fatality share (~60%) is a Strong Towns estimate based on FHWA road classification data; the methodology is not peer-reviewed. US-Sweden pedestrian fatality rate comparison is based on ITF/OECD data; direct comparison is complicated by different road classification systems, vehicle fleets, and pedestrian exposure patterns. The “jaywalking” historical claim is documented in Peter Norton’s Fighting Traffic (MIT Press, 2008). Statistical analysis performed with computational assistance.