72% of Intersection Deaths Happen in Cities. We Keep Fixing the Wrong Roads.
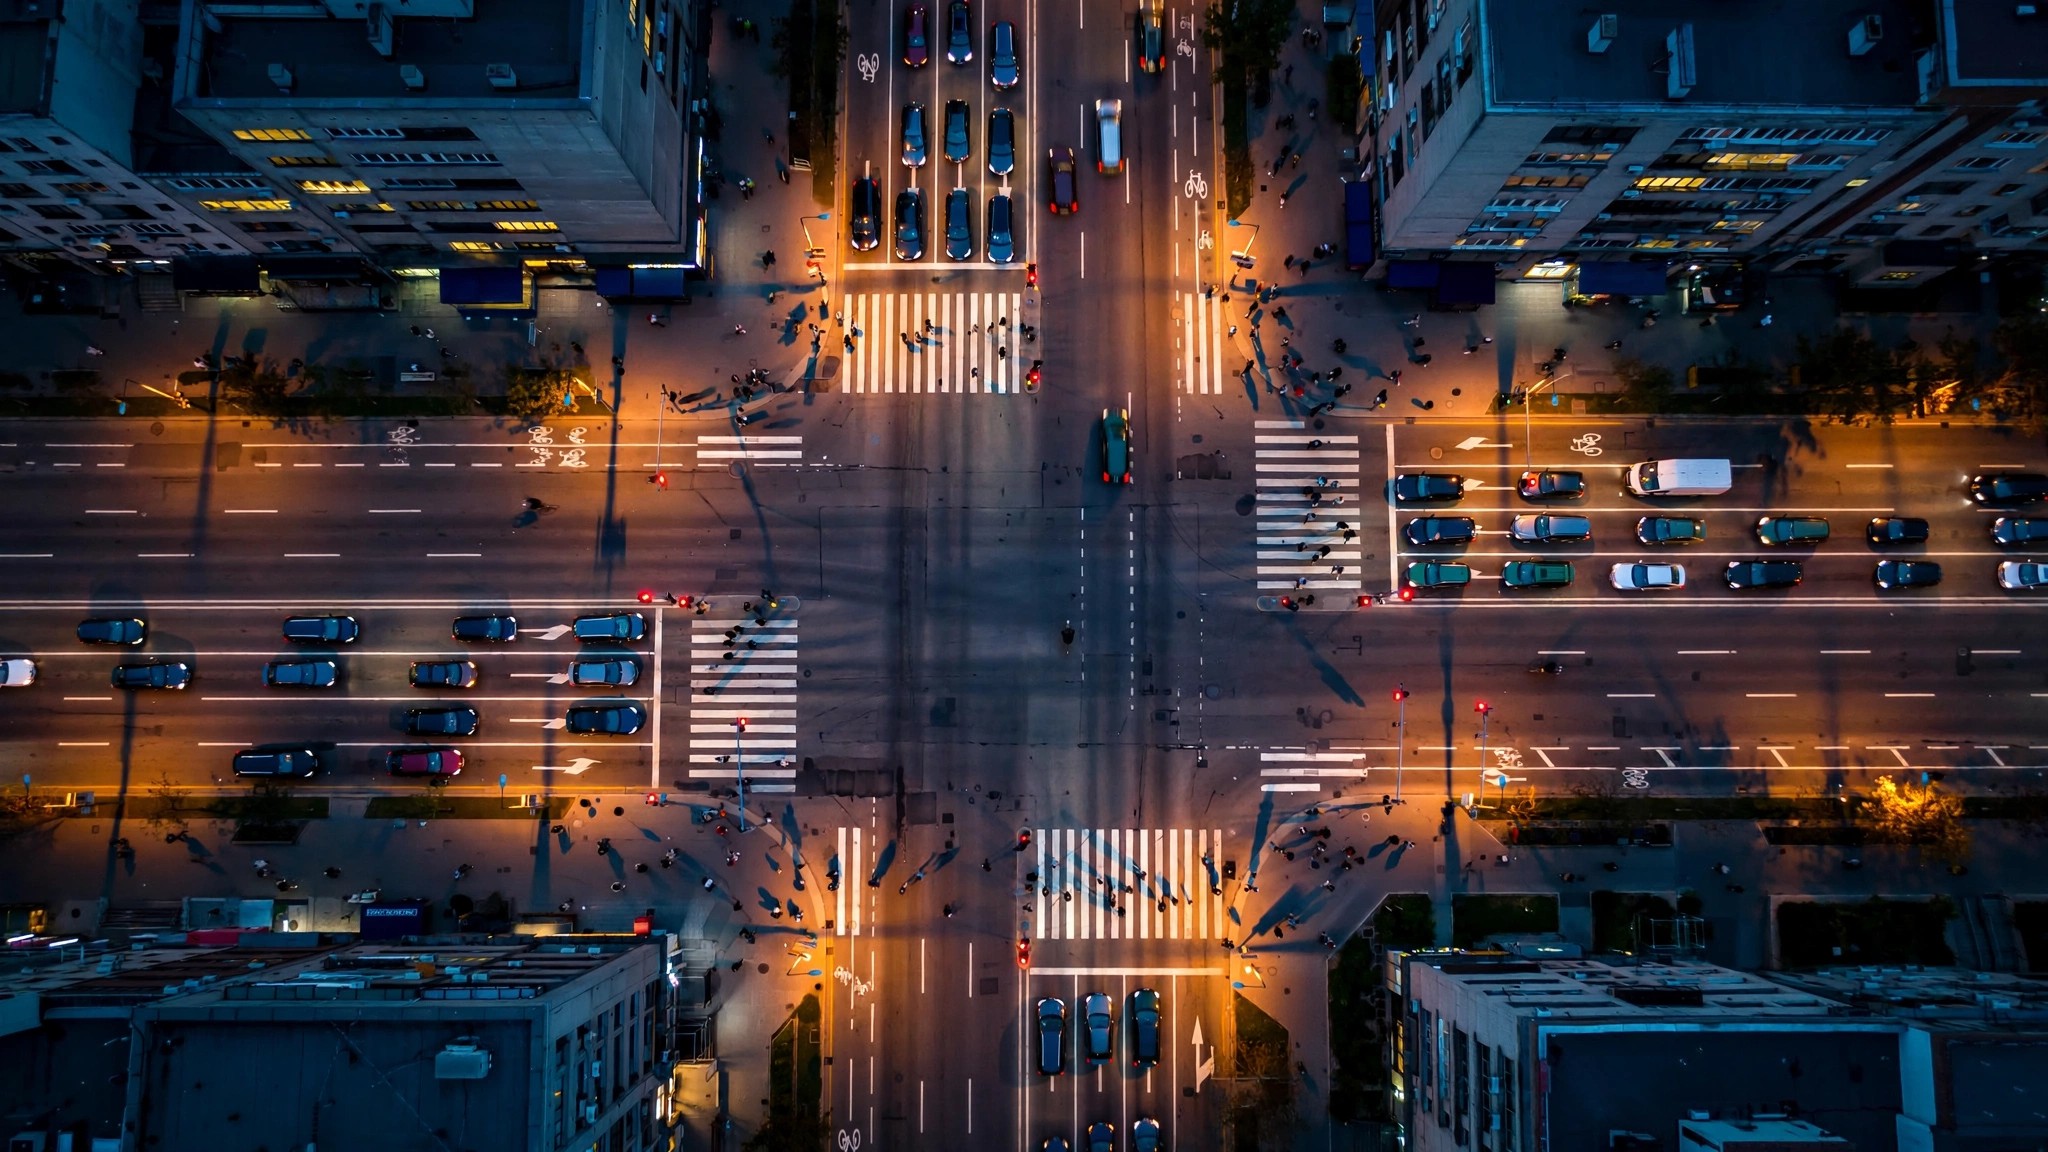
Picture the most dangerous road in America. You are almost certainly imagining a two-lane rural highway at dusk, no guardrails, maybe a deer in the ditch, and you are almost certainly wrong. In 2024, 8,518 people died at urban intersections, according to newly released NHTSA FARS data.[1] Twenty-three a day. One every 62 minutes, in places with traffic lights, crosswalks, and lane markings that were supposed to prevent exactly this.
The 2024 FARS Annual Report File, published in July 2026, splits America's 39,254 traffic fatalities into two geographies and reveals two countries. Rural roads killed 16,006 people, primarily through roadway departure: 63% of rural deaths happened when a vehicle left the travel lane and hit something immovable. Trees. Ditches. Utility poles.[1] The fix for this is well understood: guardrails, rumble strips, wider shoulders, cable median barriers. The federal government has been funding these countermeasures for decades.
Urban roads killed 22,905 people and did it differently. Only 36% of urban deaths involved roadway departure. Instead, the dominant killer was the intersection: 8,518 of 22,905 urban fatalities, 37% of the urban body count, happened where two roads meet. Another 59% happened at night, with 7,808 of those occurring on roads that had street lighting.[1]
Consider what that means. Urban intersection deaths outnumber rural intersection deaths by 2.7 to 1. But the overall urban-to-rural death ratio is 1.4 to 1. Intersections are not proportionally more dangerous in cities. They are categorically more dangerous, a distinct failure mode that rural safety spending does nothing to address. Protected left turns, adaptive signal timing, roundabout conversions, pedestrian refuge islands, smaller curb radii forcing lower turn speeds: these are the countermeasures for intersection deaths, and they cost money that historically went to straightening rural curves and installing rumble strips on two-lane highways where the fatality rate was higher per mile traveled.
That rate-based logic made sense in 2015, when rural and urban death counts were nearly equal, 17,715 rural versus 17,573 urban. It has not made sense for years. Urban fatalities climbed 30% in that decade to 22,905 while rural fatalities dropped 10% to 16,006.[1] The rural fatality rate fell 19% (1.92 to 1.56 per 100 million VMT). The urban rate rose 25% (0.81 to 1.01). A decade of infrastructure investment drove rural rates down. Cities got denser, got more SUVs, got more distracted drivers, and got worse.
NHTSA's 2025 early estimates project 36,640 total deaths, a 6.7% decline from 2024 and the second-lowest fatality rate in recorded history at 1.10 per 100 million VMT.[2] The national trend line looks good. But national trend lines are averages, and averages lie. If the rural-urban divergence held in 2025, that record low rate was purchased mostly with rural improvements that have been compounding for a decade, while urban intersections continued to chew through pedestrians and left-turning commuters at roughly the same pace.
You want the actionable version? If you commute through urban intersections, the single highest-value safety investment is a car with robust automatic emergency braking that includes a cross-traffic function. AEB will be mandated for all new vehicles by September 2029 under FMVSS No. 127, but it is already available on most new cars today.[3] If you are a city planner, the highest-value infrastructure investment is converting high-fatality signalized intersections to modern roundabouts. IIHS data shows roundabouts reduce fatal and injury crashes by 72 to 80% compared to signalized or stop-controlled intersections.[4] That single intervention matches the scale of the problem. Guardrails will not fix a T-bone collision at a four-way signal running 45 mph arterial traffic through a residential grid.
America does not have one traffic death crisis. It has two, and we have been solving the easier one.
Sources & References
- NHTSA, Rural/Urban Traffic Fatalities: 2024 Data (DOT HS 813 828), July 2026. crashstats.nhtsa.dot.gov
- NHTSA, 2025 Traffic Death Estimates & 2024 FARS, April 2026. nhtsa.gov
- NHTSA, FMVSS No. 127: Automatic Emergency Braking Final Rule, April 2024. nhtsa.gov
- IIHS, Roundabouts. iihs.org
Limitations
FARS captures only fatal crashes, not injury or property-damage-only incidents. The intersection fatality share of urban deaths (37%) may not reflect the intersection share of urban crash frequency, which is likely much higher. The 72% urban share of intersection deaths could partly reflect the simple fact that most intersections are in urban areas. The critical question is whether urban intersection fatalities per intersection are rising, which would require combining FARS data with FHWA intersection inventories. That analysis does not yet exist at a national level. The 2025 rural-urban breakdown has not been published; the projection that rural-urban divergence held is an assumption, not a finding. IIHS roundabout effectiveness data comes primarily from conversions of stop-controlled and signalized intersections, not greenfield builds; results may differ for high-speed arterials.
Strongest Counterargument
The urban fatality count is higher partly because that is where the people are. Twenty-one percent of Americans live in rural areas but drive 31% of all VMT; the remaining 69% in urban areas drive 69% of VMT. Per capita, rural areas may still be more dangerous. This piece is not arguing rural safety funding should decrease. It is arguing that urban intersection funding needs to scale with the body count, and it has not.