Drunk Driving Doesn't Explain Which SUVs Kill You. The Vehicle Does.
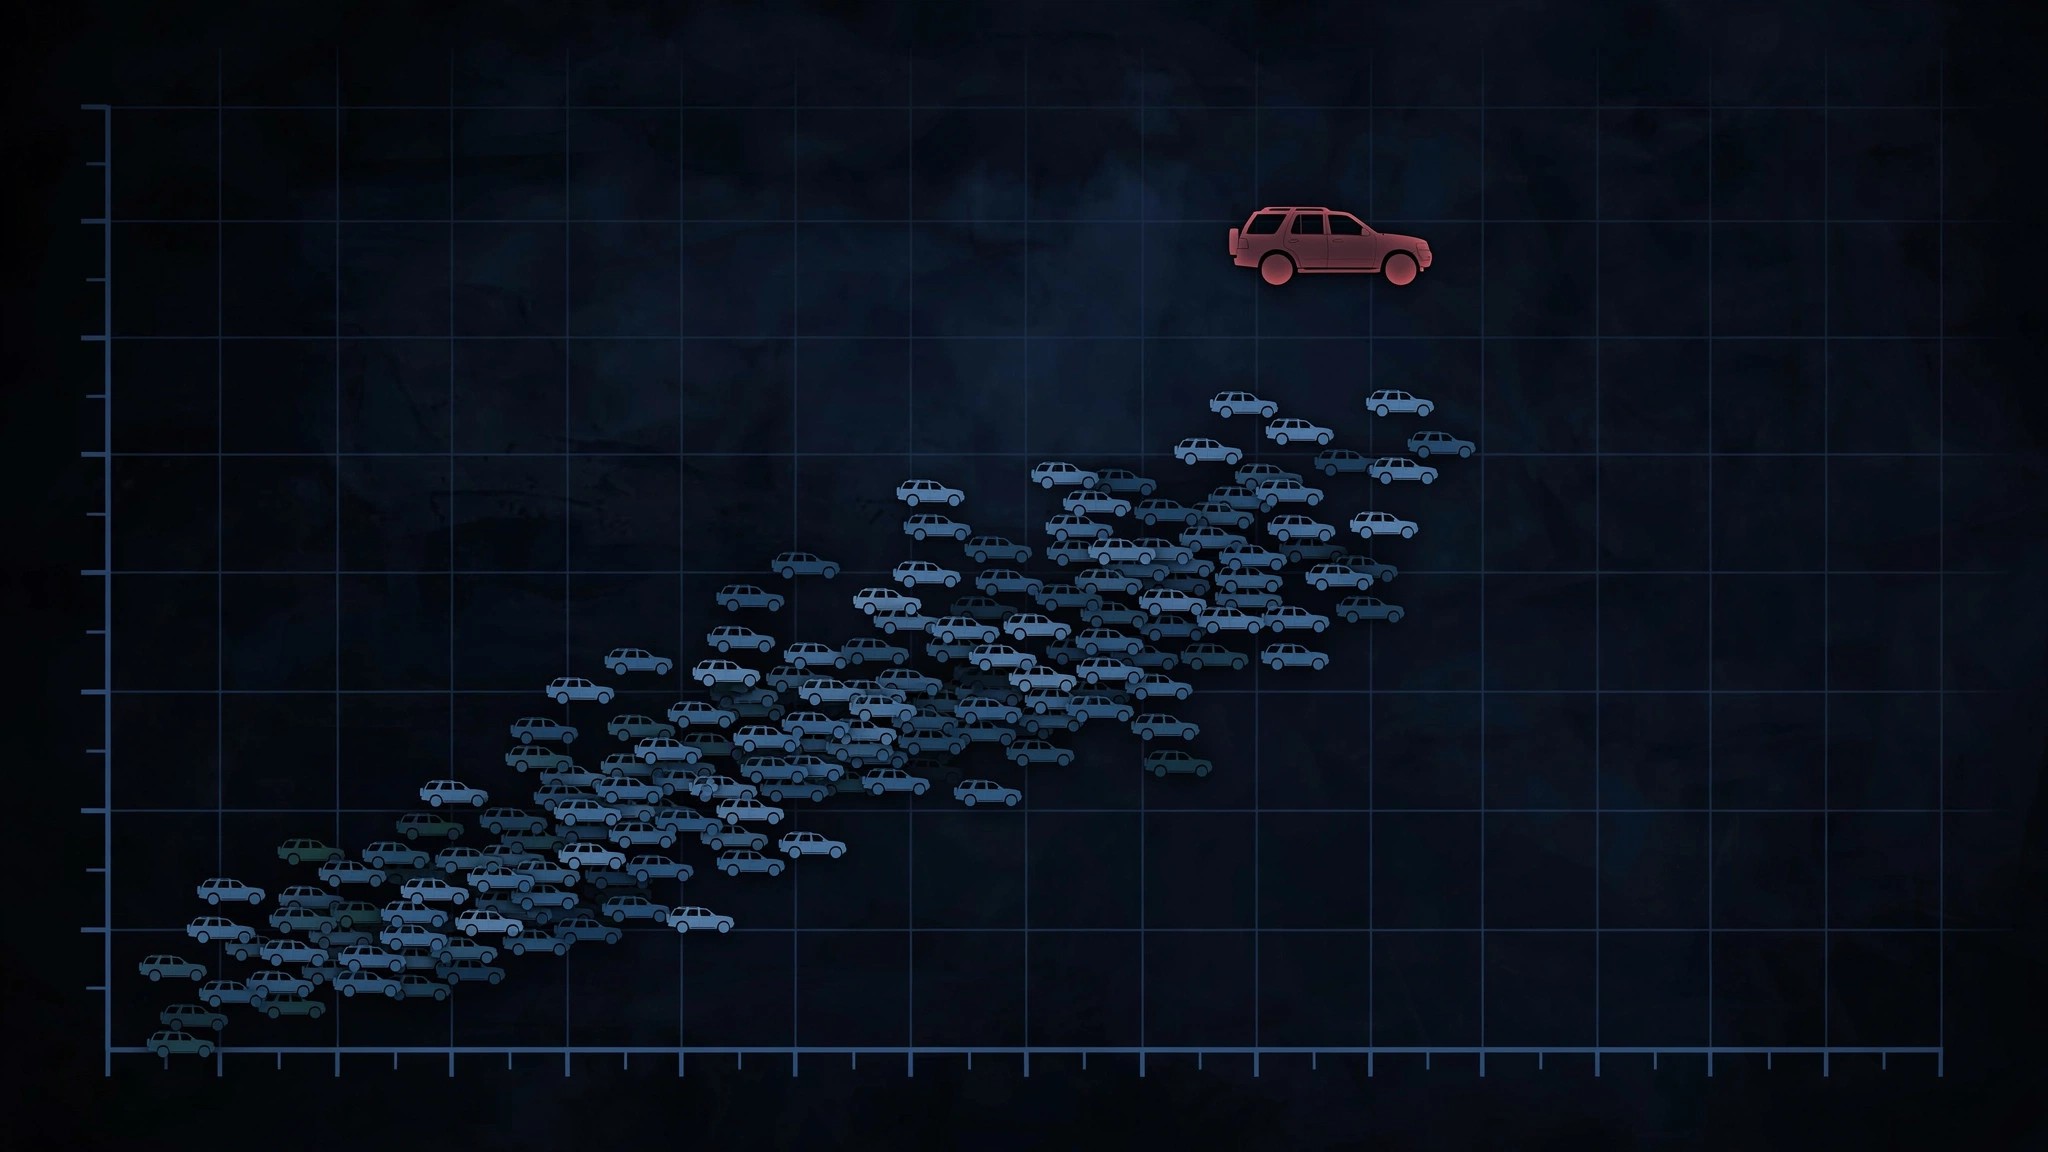
In FARS toxicology data, the Ford Explorer and the Honda Pilot post almost identical impairment rates in fatal crashes: 19.5% vs. 19.4%, the same proportion of drunk or drugged drivers showing up in the reports, year after year, crash after crash. But the Explorer's fatality rate per 100 million vehicle miles traveled is 5.3 times higher.[1]
That number comes from a cross-tabulation I ran on every SUV in the FARS database with an estimated fleet above 200,000 vehicles, covering eighty models across a decade of fatal crash data. I plotted each model's fatality rate against its impairment rate, defined as the percentage of crash-involved drivers who tested positive for alcohol, drugs, or both, and the Pearson correlation coefficient came back at 0.281.[1] Square that and you get 0.079, which means knowing how often an SUV's drivers are impaired tells you almost nothing about how often the vehicle kills people.
Run the paradox pairs and the brutality is immediate: Dodge Durango drivers show up impaired at 22.5%, the highest rate among mainstream midsize SUVs and three full percentage points above the Explorer, yet the Durango's fatality rate lands at 0.54 per 100 million VMT while the Explorer sits at 1.54. More drunk drivers in the Durango by a meaningful margin, and one-third the body count for it.
Flip the comparison and the paradox sharpens further: Subaru Ascent posts the lowest impairment rate in the entire SUV class at 8.2%, a population of remarkably sober drivers whose fatality rate still reaches 0.78. Meanwhile the Toyota Highlander, at 16.4% impairment and twice the proportion of impaired drivers behind the wheel, kills at just 0.42 per 100 million VMT, making the sober Subaru deadlier than the less-sober Toyota by a wide margin.
Zoom out to the full range of all 80 models and the gap between these two variables becomes absurd: SUV impairment rates span from 8.2% to 23.1%, only a 2.8-fold spread, while fatality rates span from 0.03 for the Tesla Model Y to 2.83 for the Chevrolet Trailblazer, a 94-fold spread.[1] When one variable moves by a factor of 3 and the other by a factor of 94, the first variable is not driving the second, and the thing that is driving it is vehicle engineering: crash structure, weight distribution, rollover propensity, safety feature adoption timelines, and fleet age composition all flowing through the rate calculation in ways that impairment simply doesn't.
Some of the Explorer's inflated rate reflects legacy body-on-frame hardware still in the FARS window, since the data spans 2014 through 2023 and captures both the older platform and the modern unibody generation. But that same vintage contamination applies to every competitor in the comparison, and none of them show anywhere near the same gap between impairment and death.
Ford seems to keep discovering this in real time. Today NHTSA published recall 26S52 covering 387,911 Ford Explorers and Lincoln Aviators, model years 2020 through 2027, for second-row seats that can unlatch, tip, or slide unexpectedly while the vehicle is in motion.[2] A seat that moves during a crash won't restrain its occupant, and Ford identified fourteen reports of unexpected seat movement in vehicles that were actively driving, six of which had already been "fixed" under an earlier recall that evidently didn't hold. Roof rail covers that detach at highway speed got their own recall expansion today too: recall 26S54 covers 288,314 more units, building on a 2021 campaign that also failed to resolve the underlying problem.[3] Add those together and 676,225 Explorers were recalled in a single week, which at some point stops being anecdotal and starts being the engineering pattern the fatality data already predicted.
Nobody wants to hear this, but the policy implication is staring at the data. Public safety campaigns overwhelmingly target driver behavior with campaigns about not drinking, not texting, and wearing seatbelts, all of which matter and which nobody should dispute. But when the data shows that which SUV you're sitting in matters more than whether the driver has been drinking, when a 3-percentage-point difference in impairment coexists with a 5x difference in fatality rate, the emphasis looks misplaced. We spend billions on enforcement, public service announcements, and sobriety checkpoints while spending almost nothing telling consumers that their SUV choice is, statistically, a bigger predictor of whether they survive a crash than whether the other driver had two beers.
Sources & References
- NHTSA, Fatality Analysis Reporting System (FARS), 2014–2023. All fatality counts, fatality rates per 100M VMT, and toxicology data (impairment percentages). Cross-tabulation of rate vs. impairment for 80 SUV models with estimated fleet >200,000. nhtsa.gov
- NHTSA Recall 26S52, Ford Motor Company, 387,911 2020–2026 Ford Explorer and 2020–2027 Lincoln Aviator vehicles. Second-row easy-entry seat switch may bind or stick, causing seats to unlatch. Published July 21, 2026. nhtsa.gov/recalls
- NHTSA Recall 26S54, Ford Motor Company, 288,314 2016–2019 Ford Explorer vehicles; roof rail covers may detach from vehicle, expanding prior recall 21V316. Published July 2026. nhtsa.gov/recalls
Limitations
FARS captures only fatal crashes, and the roughly 37,000 annual deaths represent a fraction of the approximately 6.7 million total crashes, meaning a vehicle with a low fatality rate could still have a high injury rate that this analysis cannot distinguish. Estimated VMT uses industry sales data and NHTS average mileage assumptions, introducing ±15% uncertainty for lower-volume models. Fleet composition varies by vehicle and affects the rate calculation: the Explorer's inclusion of pre-2011 body-on-frame units pulls its rate upward, though competitors face analogous vintage contamination in the same data window. Toxicology testing completeness varies by state and jurisdiction, and since some crash-involved drivers are never tested, impairment percentages represent a floor rather than a census. Finally, the Pearson correlation measures only linear association, so a nonlinear relationship between impairment and fatality rate could exist without being captured by this metric.
What to do: If you're shopping for a midsize three-row SUV and you've been comparing the Explorer to a Highlander, Pilot, or Traverse, know that the FARS fatality rate gap between them ranges from 3.7x to 7.7x while impairment rates are nearly identical across all four, meaning the gap isn't explained by who's driving these vehicles but by the vehicles themselves. Check any used Explorer's VIN at nhtsa.gov/recalls, where there are currently multiple open campaigns including one published today for seats that can come loose at speed.