NHTSA Says Speeding Catches Up with You. It Already Caught 10,035 People Last Year.
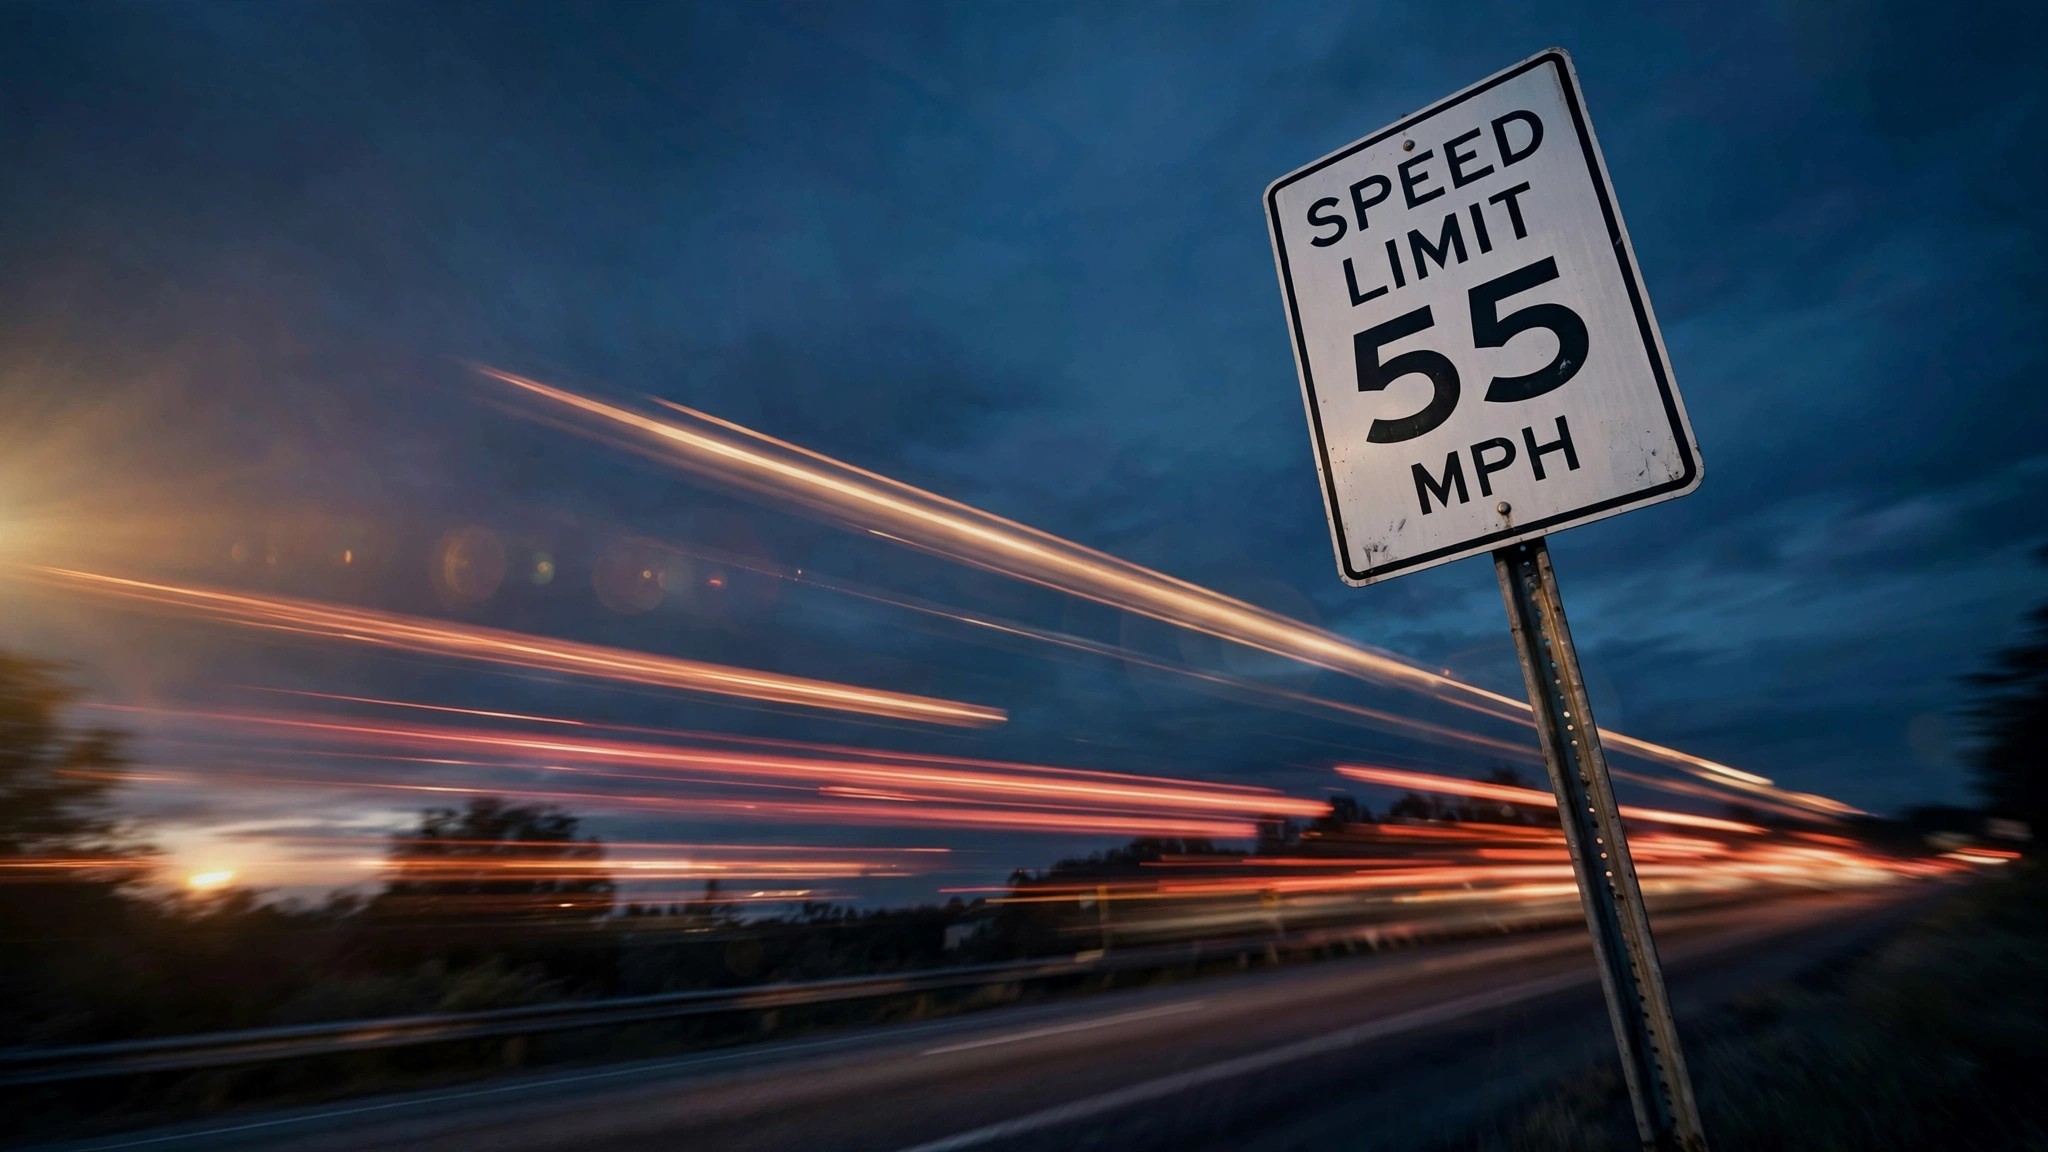
On July 6, NHTSA Administrator Jonathan Morrison stood in Nashville beside a NASCAR team owner and announced a campaign called "Speeding Catches Up with You." Three days later, his own agency released the data proving exactly how many people it had already caught: 10,035 dead from speed-related crashes in 2025, plus another 316,757 injured the year before that.[1]
The decline is genuine. Speeding deaths dropped 11 percent from 2024's 11,288, which NHTSA says represented 29 percent of every traffic fatality that year. That's a return to pre-pandemic levels not seen since 2019, and the speeding decline outpaced the overall fatality drop by a wide margin. Good news, if you define good news as killing roughly 27 people a day instead of 31.[2]
Morrison's quote from the campaign launch deserves to be read in full: "Unless you're a racecar driver on the track, there's no excuse for speeding. Speeding puts everyone's lives at risk, making crashes more severe and less survivable." He is correct. He is also describing a mathematical inevitability, not a moral failing. Kinetic energy scales with the square of velocity. A 70 mph crash delivers 96 percent more energy than a 50 mph crash. Physics does not negotiate, and it doesn't need a slogan.
But the really uncomfortable part isn't the body count. It's what the vehicles tell us about where the campaign's theory breaks down.
FARS data covering a decade of fatal crashes shows the vehicles with the highest death rates per 100 million miles are not all sports cars driven by reckless twenty-somethings. Hyundai's Veloster leads the entire FARS database at 8.54 deaths per 100 million VMT, followed by the Ford Mustang at 6.02. But the Chevrolet Cobalt sits at 5.10, the S-10 pickup at 4.83, the Toyota Solara at 4.25, and your grandmother's Buick LeSabre clocks in at 2.67. None of these are performance machines, and most haven't been manufactured in a decade or more.[3]
Cross-referencing death rates with toxicology data inverts the picture further. Solara drivers show a 4.1 percent impairment rate in fatal crashes, one of the lowest in the entire dataset, meaning they are overwhelmingly sober when they die at 4.25 per 100 million VMT in a 2,800-pound convertible-platform sedan from 2008 with the structural rigidity of a screen door. Speed isn't the primary assassin here; design vintage is.
NHTSA's campaign frames speeding as a choice, and for the Mustang owner who buries the needle on an empty highway at 2 AM, it is. But the broader FARS picture says something different: the majority of America's speed-adjacent body count comes from vehicles that are simply too old, too light, and too structurally obsolete to survive the speeds that modern roads are built to accommodate. A 2006 Cobalt hitting a concrete median at 55 mph is already exceeding its structural design envelope. That's not reckless driving; that's the posted limit.
Sports cars do carry a disproportionate toll. They account for 3.2 percent of all FARS fatalities while representing just 1.7 percent of the registered fleet, yielding a 1.93-times overrepresentation ratio. But flip the lens: if you eliminated every sports car death in the dataset, the remaining 96.8 percent of fatalities would continue essentially unchanged. Mustangs are easy targets for a campaign poster. They are a rounding error in the spreadsheet.[3]
The real mechanism behind the 11 percent speeding decline is quieter and less photogenic than a Nashville press conference. Newer vehicles come standard with automatic emergency braking that intervenes before a speed-related collision, lane-keeping assist that corrects the drift turning a speeding car into a departing-the-roadway car, and crash structures that absorb more energy upon impact. And every year, the oldest, most lethal vehicles in the fleet go to the crusher: the Cobalt fleet shrinks, the S-10 population declines, and the Cavalier, whose occupant dies in 86 percent of fatal crashes it enters, ages off the registration rolls one junkyard at a time.
NHTSA's own subcategory data for 2024 confirms this: passenger vehicle occupant fatalities in vehicles less than 10 years old fell 8 percent, while deaths in vehicles 10 years and older fell only 5 percent. America's fleet is bifurcating into two populations. Newer cars are getting dramatically safer while older cars drag the national average up until they rust away, and the campaign targets driver behavior while the data says the improvement is engineering.[4]
None of this makes the 10,035 acceptable, but it makes the campaign incomplete. "Speeding Catches Up with You" is aimed at the Charger driver doing 95 in a 55. It has nothing to say to the family in a 2009 Malibu doing 60 on a rural highway designed for 75, in a car that will crumple like tinfoil in a frontal offset because it predates the IIHS small-overlap test by three years. That family isn't speeding, yet they're driving the speed limit in a vehicle that can't survive it.
What to do: If you drive a vehicle manufactured before 2012, you are in a car that likely lacks AEB, lane departure warning, and the structural upgrades mandated by the 2012 IIHS small-overlap test arms race. Posted speed limits were designed for the road geometry, not for your car's structural capability. Consider whether your vehicle was engineered to survive the speed you're traveling. Check whether your vehicle has any outstanding safety recalls at nhtsa.gov/recalls.
Strongest counterargument: Speeding IS a behavioral choice, and campaigns do change behavior. NHTSA's own high-visibility enforcement campaigns for seatbelts pushed usage from 58 percent in 1994 to 92 percent in 2024. If speed-enforcement campaigns produced even a 5 percent behavioral shift, that's 500 lives. Campaigns don't have to solve the whole problem to justify their existence, and Morrison's framing isn't wrong. It's just pointed at the visible minority of the problem.
What this analysis doesn't prove: FARS death rates are not a direct measure of speeding involvement. A vehicle's high fatality rate captures structural vulnerability, fleet age, driver demographics, road types driven, and impairment patterns in addition to speed. We cannot extract a per-model speeding death count from this data. An 11 percent decline in speeding deaths could reflect behavioral change from enforcement, technology adoption, fleet turnover, or pandemic behavioral normalization, and likely reflects all four in unknown proportions.
Sources & References
- NHTSA, “Speeding Catches Up with You” campaign launch and Q1 2026 fatality estimates, July 8, 2026. nhtsa.gov
- Shepardson, D., “US traffic deaths fell sharply in early 2026,” Reuters, July 8, 2026. Full-year 2025: 1.10 fatalities per 100M VMT (second-lowest ever); Q1 2026: 0.99 per 100M VMT. Reuters via SRN News
- NHTSA, Fatality Analysis Reporting System (FARS), 2014–2023 final files. Death rates, fleet estimates, and toxicology cross-tabulations by model. nhtsa.gov
- NHTSA, Early Estimates of Motor Vehicle Traffic Fatalities and Fatality Rate by Sub-Categories in 2024, DOT HS 813 729, May 2025. PV occupant fatalities in vehicles <10 years old down 8%; ≥10 years old down 5%. crashstats.nhtsa.dot.gov
Source: NHTSA FARS 2014–2023, NHTSA Q1 2026 early estimates, NHTSA 2024 subcategory report. FARS death rates use estimated VMT by model and carry ±15% uncertainty for low-volume vehicles. Speeding-related fatality estimates for 2025 are preliminary. See methodology for caveats.