The Vehicles That Crash the Most Have the Soberest Drivers
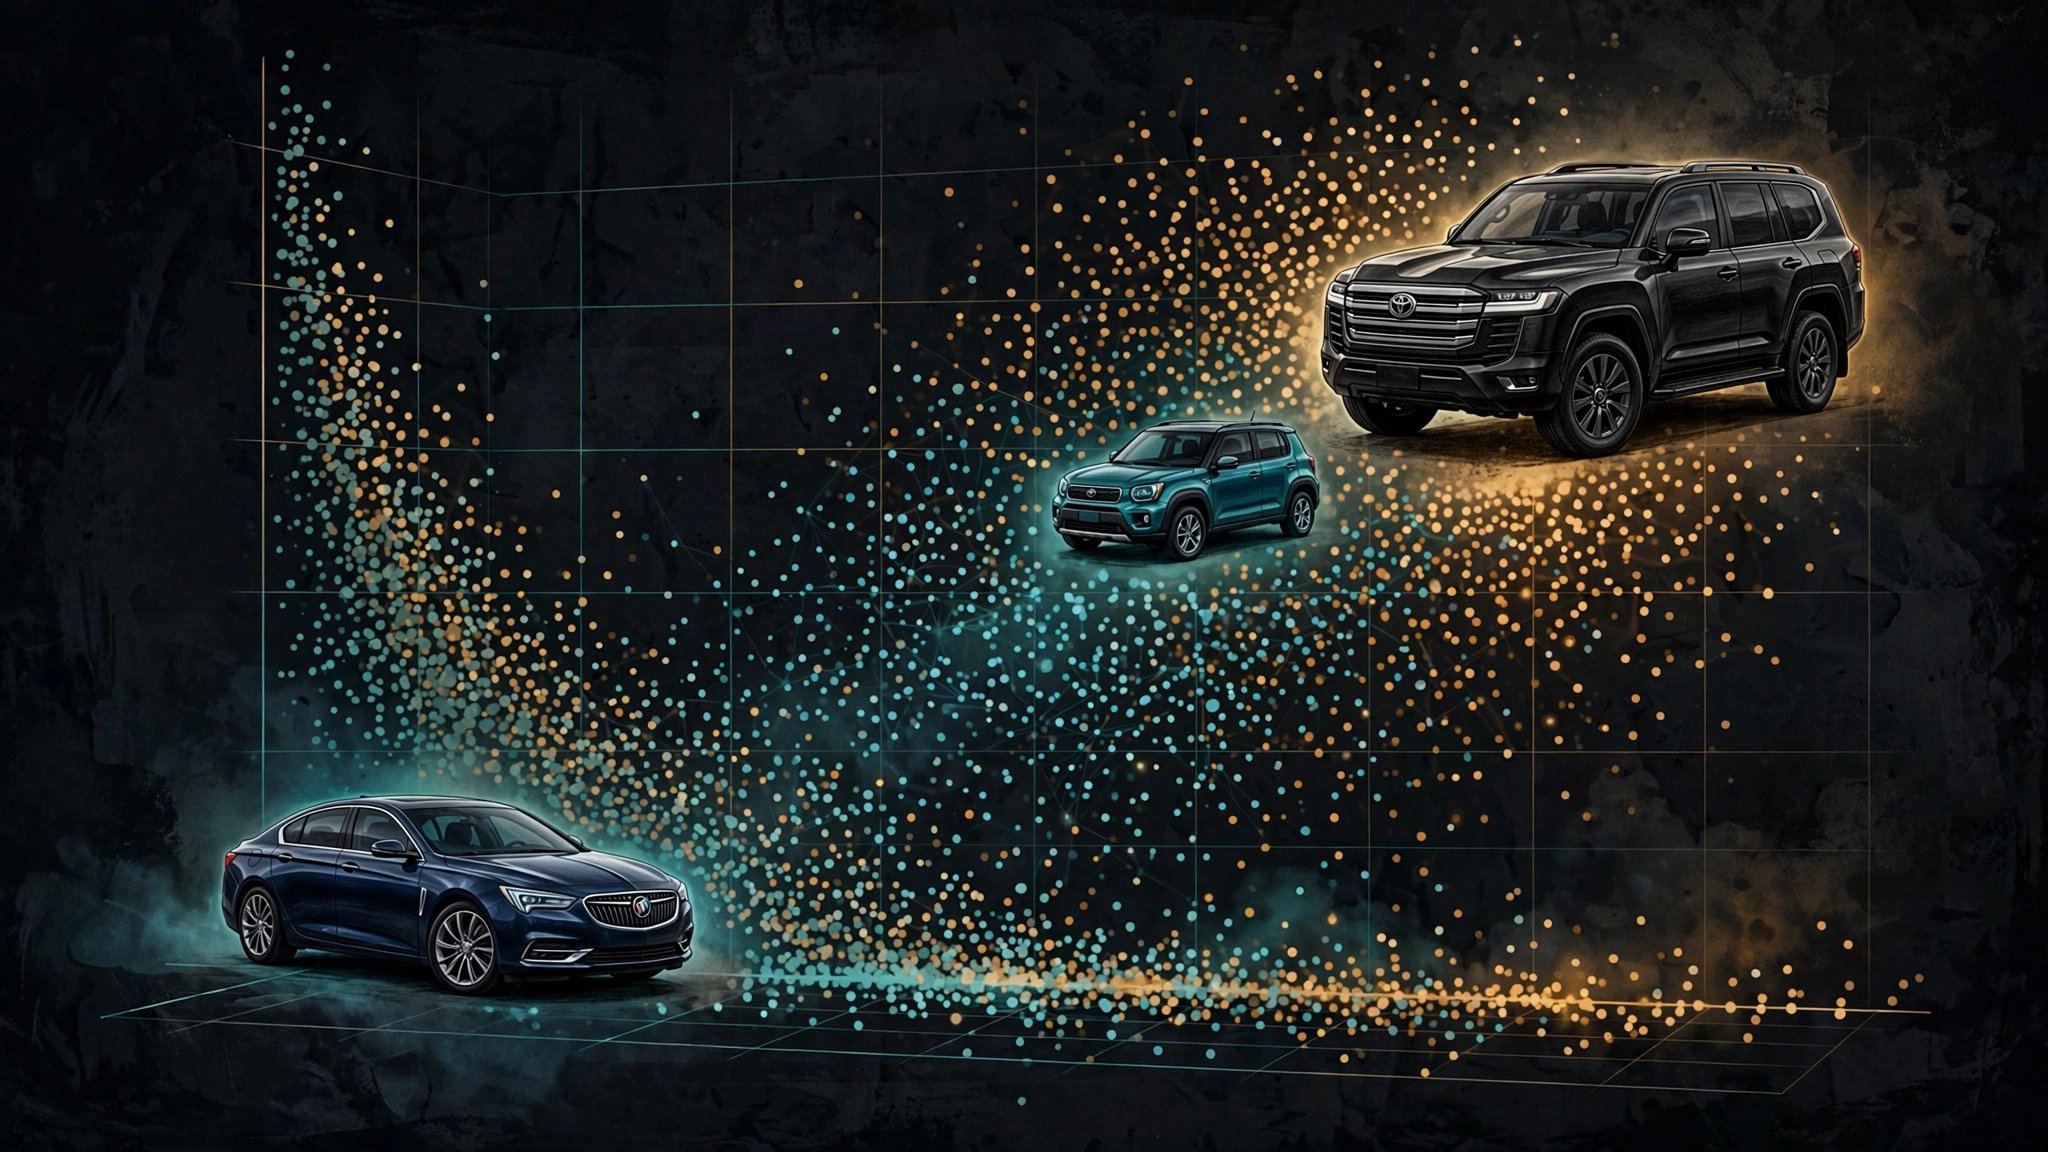
I ran a Pearson correlation between crash frequency and driver impairment across every vehicle model in FARS with enough data to matter. r = −0.23. Negative. Vehicles that appear in fatal crashes most often per mile driven have lower impairment rates than the ones that crash rarely.
Toyota's Land Cruiser leads the dataset at 180.6 fatal crash involvements per 100 million VMT with an impairment rate of 8.9 percent, less than half the FARS average of roughly 20 percent.[1] Chevrolet's Tracker follows at 142.4 with 12.7 percent impairment. Run it in reverse: Buick's Park Avenue crashes at just 5.5 per 100 million VMT, but when it does, 31.7 percent of the drivers are impaired. Low frequency, high impairment: a bar car that just doesn't drive much.
Three explanations compete for what's producing this pattern. Vehicle design is the first and most damning: rollover-prone SUVs and top-heavy trucks kill sober drivers because the vehicle itself is structurally dangerous, no impairment required.[2] Demographics is the second: Ford's E-350, a church van and institutional shuttle, sits at 61.1 crash frequency with only 15.7 percent impairment because commercial and fleet drivers are sober by regulation, fatigued by occupation, and undertrained on a vehicle that handles nothing like a passenger car. Exposure context is the third: that absurd Land Cruiser frequency may reflect rural and off-road usage patterns where crash severity is amplified but nobody's drunk at 7 a.m. on a dirt road.
Here's the strongest counterargument, stated at full strength: the negative correlation is entirely a Simpson's paradox artifact driven by age demographics, where older drivers simultaneously drink less and drive fewer miles, creating the illusion of an inverse relationship between impairment and crash frequency across vehicle types. Strip out age and usage type, and the correlation might vanish entirely. Maybe. But Toyota's Solara refuses to cooperate with that explanation. It's a Camry-based coupe marketed to middle-aged buyers seeking mild weekend enjoyment, and its impairment rate is 4.1 percent while crashing at 62.1 per 100 million VMT, above the Camaro and more than six times the dataset median.[1] Something about the Solara itself is generating sober fatal crashes at an extraordinary rate.
If you're shopping for a used vehicle, check more than the star rating. Pull the specific model's FARS death rate at the IIHS fatality statistics page.[3] If a model sits in the high-frequency, low-impairment quadrant, the risk is structural. You can be the most careful, most sober driver on the road, and the vehicle will still kill you at a rate that drunk drivers in Park Avenues can't match.
Sources & References
- NHTSA, Fatality Analysis Reporting System (FARS), 2014–2023. Crash frequency computed as fatal crash involvements per 100 million estimated VMT. Impairment defined as any positive BAC or drug toxicology. nhtsa.gov
- IIHS, Vehicle Size and Weight. Rollover propensity and center-of-gravity dynamics in SUVs. iihs.org
- IIHS, Fatality Statistics: Passenger Vehicle Occupants. Driver death rates by make and model. iihs.org
Source: NHTSA FARS 2014–2023. Pearson correlation computed across vehicle models with ≥50 fatal crash involvements and ≥50 million estimated VMT. Impairment testing coverage is not uniform across states or crash types, which may bias the impairment denominator. VMT estimates use fleet size × average annual miles, not odometer readings, introducing ±15% uncertainty. Correlation does not establish causation; demographic confounders (driver age, geography, commercial vs. personal use) may explain part or all of the observed relationship. See methodology for caveats.