The Kill Ratio: Your Car’s Safety Rating Is Someone Else’s Death Sentence
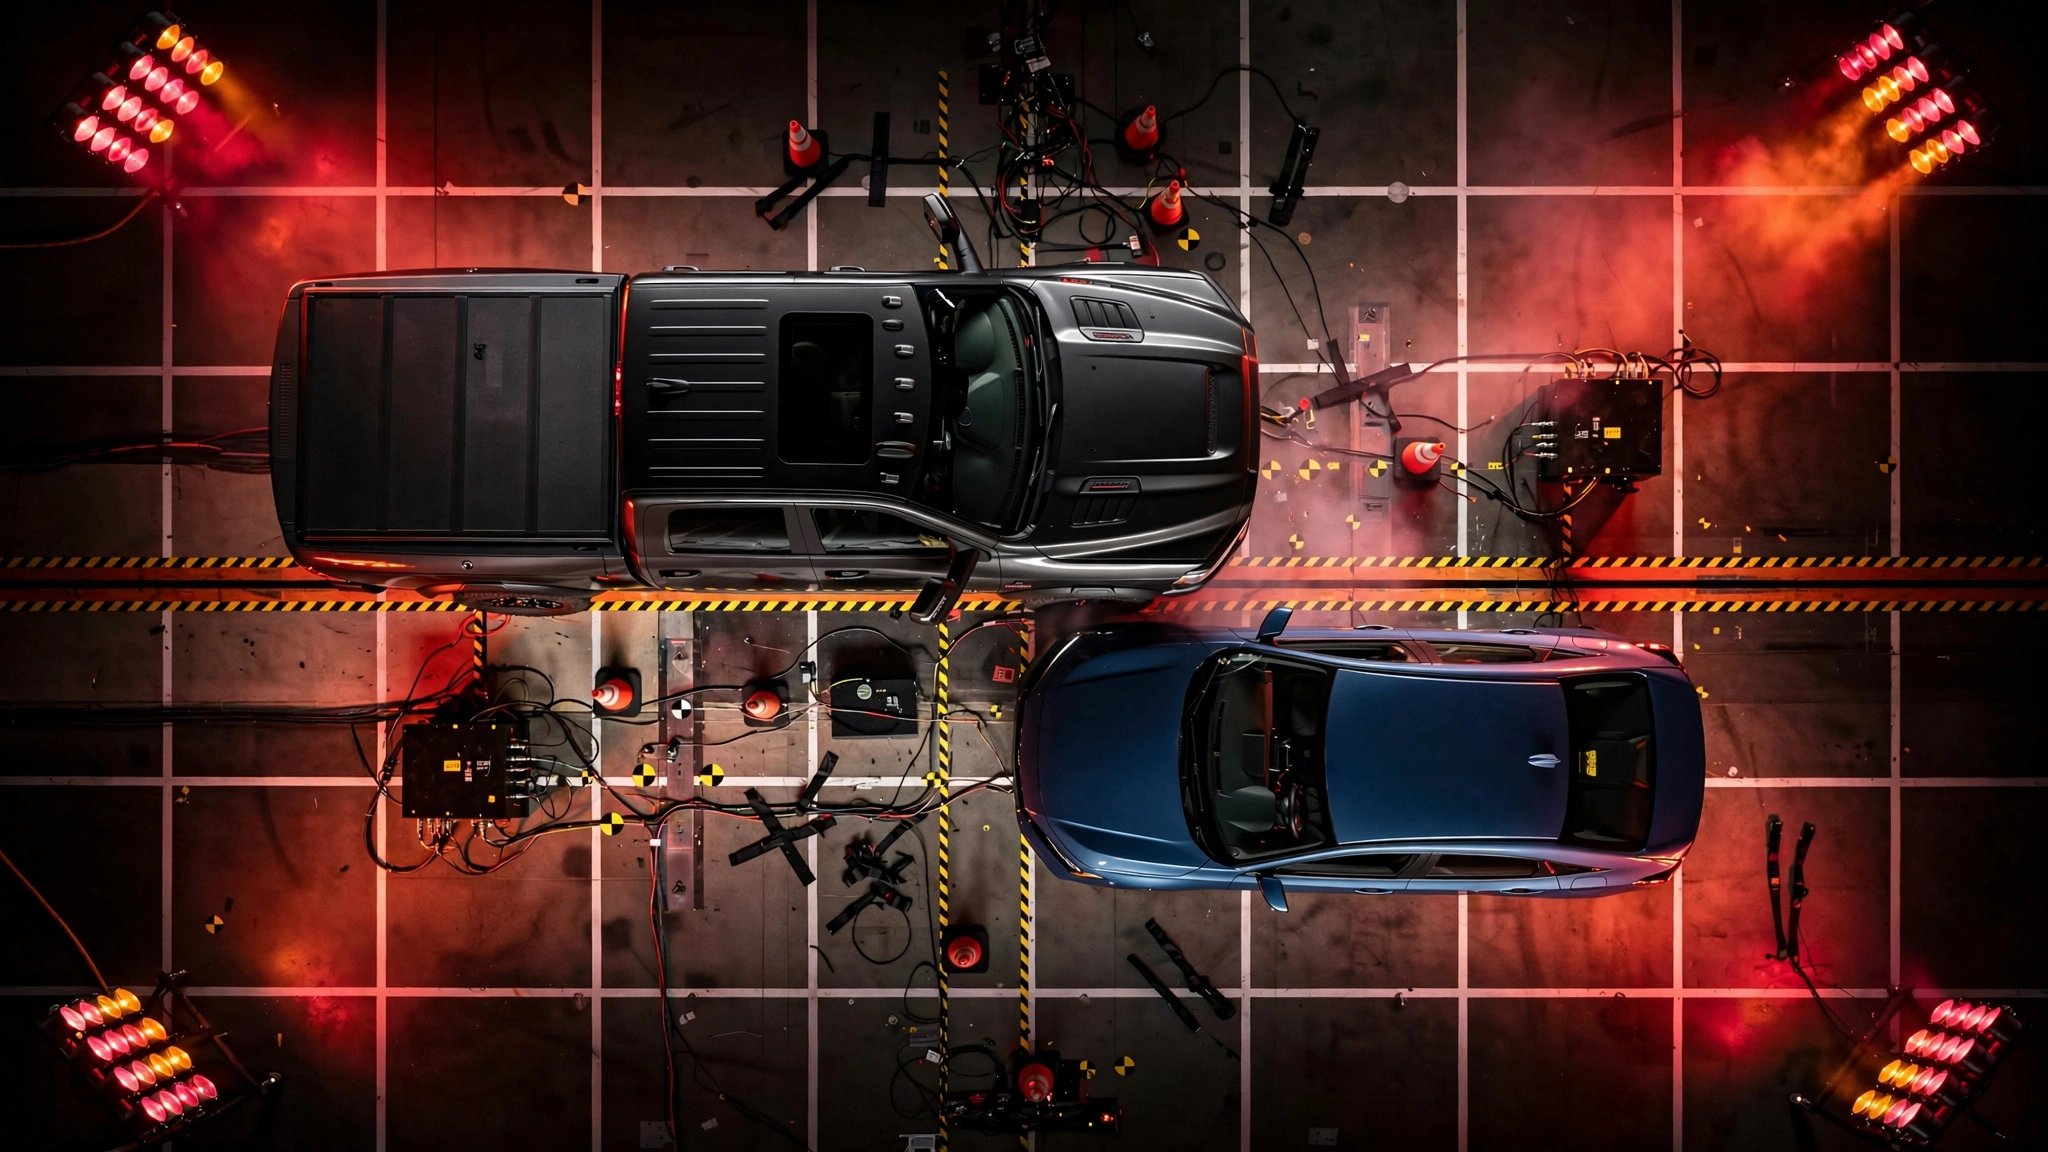
A Ram 2500 was involved in 748 fatal crashes between 2014 and 2023, and its occupants died in only 153 of them. That is a deaths-per-crash ratio of 0.205, the lowest of any vehicle in the FARS database with a meaningful sample size, and it raises a question the safety industry would rather not engage with: if 595 of those crashes still killed somebody, and it wasn't the Ram driver, then who was it?
I ran a calculation nobody seems to publish. Take the FARS data on every vehicle model with at least 500 fatal crash involvements over the last decade, divide occupant deaths by crash involvements, and you get a number between 0 and 1 that measures something the brochures won’t tell you: when your car is in a crash that kills someone, how often is the dead person you?
At the top of the list sit vehicles you would never buy today even if you could still find them on a lot. Dead since 2005, the Chevrolet Cavalier converts fatal crash involvements into occupant deaths at 0.857, meaning in nearly every crash where someone dies, the person dying is the Cavalier driver or passenger. Right behind it: the Dodge Neon at 0.856, followed by the Buick LeSabre at 0.823 and the Chevrolet Cobalt at 0.808, the car GM knew had a defective ignition switch for over a decade before issuing a recall that covered 2.6 million vehicles and acknowledged at least 124 deaths.[1]
Class-level breakdowns tell a simpler, uglier story. Sports cars average 0.682 deaths per crash involvement, sedans 0.645, SUVs 0.524, vans 0.514, and pickups 0.489. If you are in a sedan and you are in a fatal crash, you are 32% more likely to be the dead person than if you are in a pickup truck involved in an identical scenario. That gap is not a function of crumple zone engineering or five-star NHTSA ratings, though those contribute at the margins; it is overwhelmingly a function of mass, and the physics of mass transfer in a collision are not subtle: kinetic energy is conserved, and the lighter object decelerates harder.[2]
Now for the moral algebra. Between 6,200 and 7,700 pounds depending on configuration, the Ram 2500 outweighs a Honda Civic by roughly two to one. A Civic’s deaths-per-crash ratio sits at 0.680: its occupants die in two thirds of fatal crash involvements, over three times the Ram’s 0.205. When these two vehicles meet in an intersection at 45 mph, physics doesn’t negotiate. One driver walks away with bruised ribs and a police statement to give. One does not walk away. And the Ram’s brochure (accurately) calls this “best-in-class occupant protection.”
IIHS has studied this phenomenon under the label “aggressivity,” a vehicle’s tendency to inflict fatalities on occupants of crash-partner vehicles, but that research uses matched-pair methodologies that obscure the per-model clarity you get from simply dividing deaths by crashes across the full FARS dataset.[3] What the raw ratio reveals is this: the American vehicle fleet is running an ongoing, unregulated, and deeply consequential experiment in externalized risk, where every additional pound your vehicle gains is a pound of impact energy absorbed by someone else’s body in a crash, and the consumer incentive structure (buy bigger, feel safer, see your insurance premiums confirm it) ensures the arms race only runs one direction.
A counterargument writes itself, and it is not wrong: many vehicles at the top of the lethality list are old designs without electronic stability control, without side curtain airbags, without automatic emergency braking, and without structural engineering calibrated to modern crash test protocols. Cavalier and Neon are engineering relics from an era when side curtain airbags were a dealer upsell. LeSabre’s body-on-frame architecture was designed when Jimmy Carter was relevant. Fleet age is doing real work in these numbers. But the counter-counterargument also writes itself: the 2014–2023 FARS window includes plenty of modern sedans, and their ratios are still substantially higher than modern pickups of the same vintage. Both the Honda Accord (0.644) and Toyota Camry (0.593) are among the most commonly sold, most thoroughly crash-tested, most safety-awarded sedans in history, and in a fatal crash, their occupants still die at roughly double the rate of a Ram 1500 occupant (0.341). Engineering helps. Mass helps more.
At the system level, this is a tragedy of the commons that transportation policy has not yet confronted honestly. If every driver independently optimizes for personal survival by purchasing a heavier vehicle, the total number of crash fatalities does not decrease; it redistributes from the heavy to the light, from the rich to the poor, from the SUV buyer who read the safety ratings to the used-Civic buyer who could not afford to. Every “safest car in America” listicle that ranks vehicles by occupant protection without mentioning partner-vehicle lethality is, in effect, telling the reader: here is how to make someone else’s family absorb the risk that used to be yours.
Sources & References
- General Motors ignition switch recalls, Wikipedia. wikipedia.org
- IIHS, “Vehicle size and weight,” topic overview. iihs.org
- NHTSA, Fatality Analysis Reporting System (FARS), 2014–2023 annual files. nhtsa.gov
What you should do: If you drive a sedan built before 2015, your kill ratio is likely above 0.7, meaning in a fatal crash, you are almost certainly the one dying. Upgrading to a modern compact SUV (Equinox at 0.558, CR-V at 0.533, RAV4 at 0.498) meaningfully improves your survival odds without requiring a 7,000-pound truck. If you do drive something heavy: recognize that your safety is partially borrowed from everyone around you, drive accordingly, and do not pretend your five-star rating is the whole picture. Check your vehicle’s recall status at nhtsa.gov/recalls.