Every Category of Traffic Death Declined Last Year. Except People Over 65.
NHTSA sliced its first-half 2024 fatality data into every subcategory it tracks: pedestrians down 3%, cyclists down 1%, drivers down 3%, passengers down 7%, nighttime crashes down 4%, speeding fatalities down 6%, rollovers down 6%. Two groups bucked the trend: motorcyclists went up 1%, and people over 65 also went up 1%.
Motorcyclists get the campaigns, the advocacy groups, the helmet law debates, and the media coverage that comes with leather and chrome. The over-65 divergence gets a footnote buried in a supplemental data table, which is a problem, because the decade-long numbers behind that footnote are worse than the half-year snapshot suggests. From 2014 to 2023, traffic fatalities among people 65 and older climbed 38%, with male fatalities rising 46%, pedestrian deaths surging 56%, and cyclist deaths in the same age group doubling outright.[1]
Blame population growth if you want to feel better about it: the 65-plus population grew roughly 29% over that period, from 46.2 million to 59.4 million. But a 38% fatality increase on 29% population growth means the per-capita risk climbed too, and the rate per 100,000 people 65 and older went from about 9.9 to 12.5, a 26% jump that cannot be explained away by more candles on the national birthday cake.[2]
Then there is the map, which looks suspiciously like a transit funding map. Mississippi's older-driver fatal crash involvement rate is 32.4 per 100,000 licensed drivers; Vermont's is 5.0, a 6.5-to-1 ratio for the same demographic separated only by state lines.[3] That ranking correlates less with how many retirees live in each state than with rural road design, prevailing speed limits, and whether a 78-year-old has any realistic alternative to driving herself to the pharmacy.
NHTSA estimated 36,640 traffic fatalities in 2025, down 6.7% from 2024, and by Q1 2026 the rate had dropped below 1.0 per 100 million VMT for the first time in over a decade.[4] Nearly every arrow on the dashboard points down, but the 65-plus group, the fastest-growing demographic in the country, has its arrow aimed the other direction, and nobody is running a campaign about it.
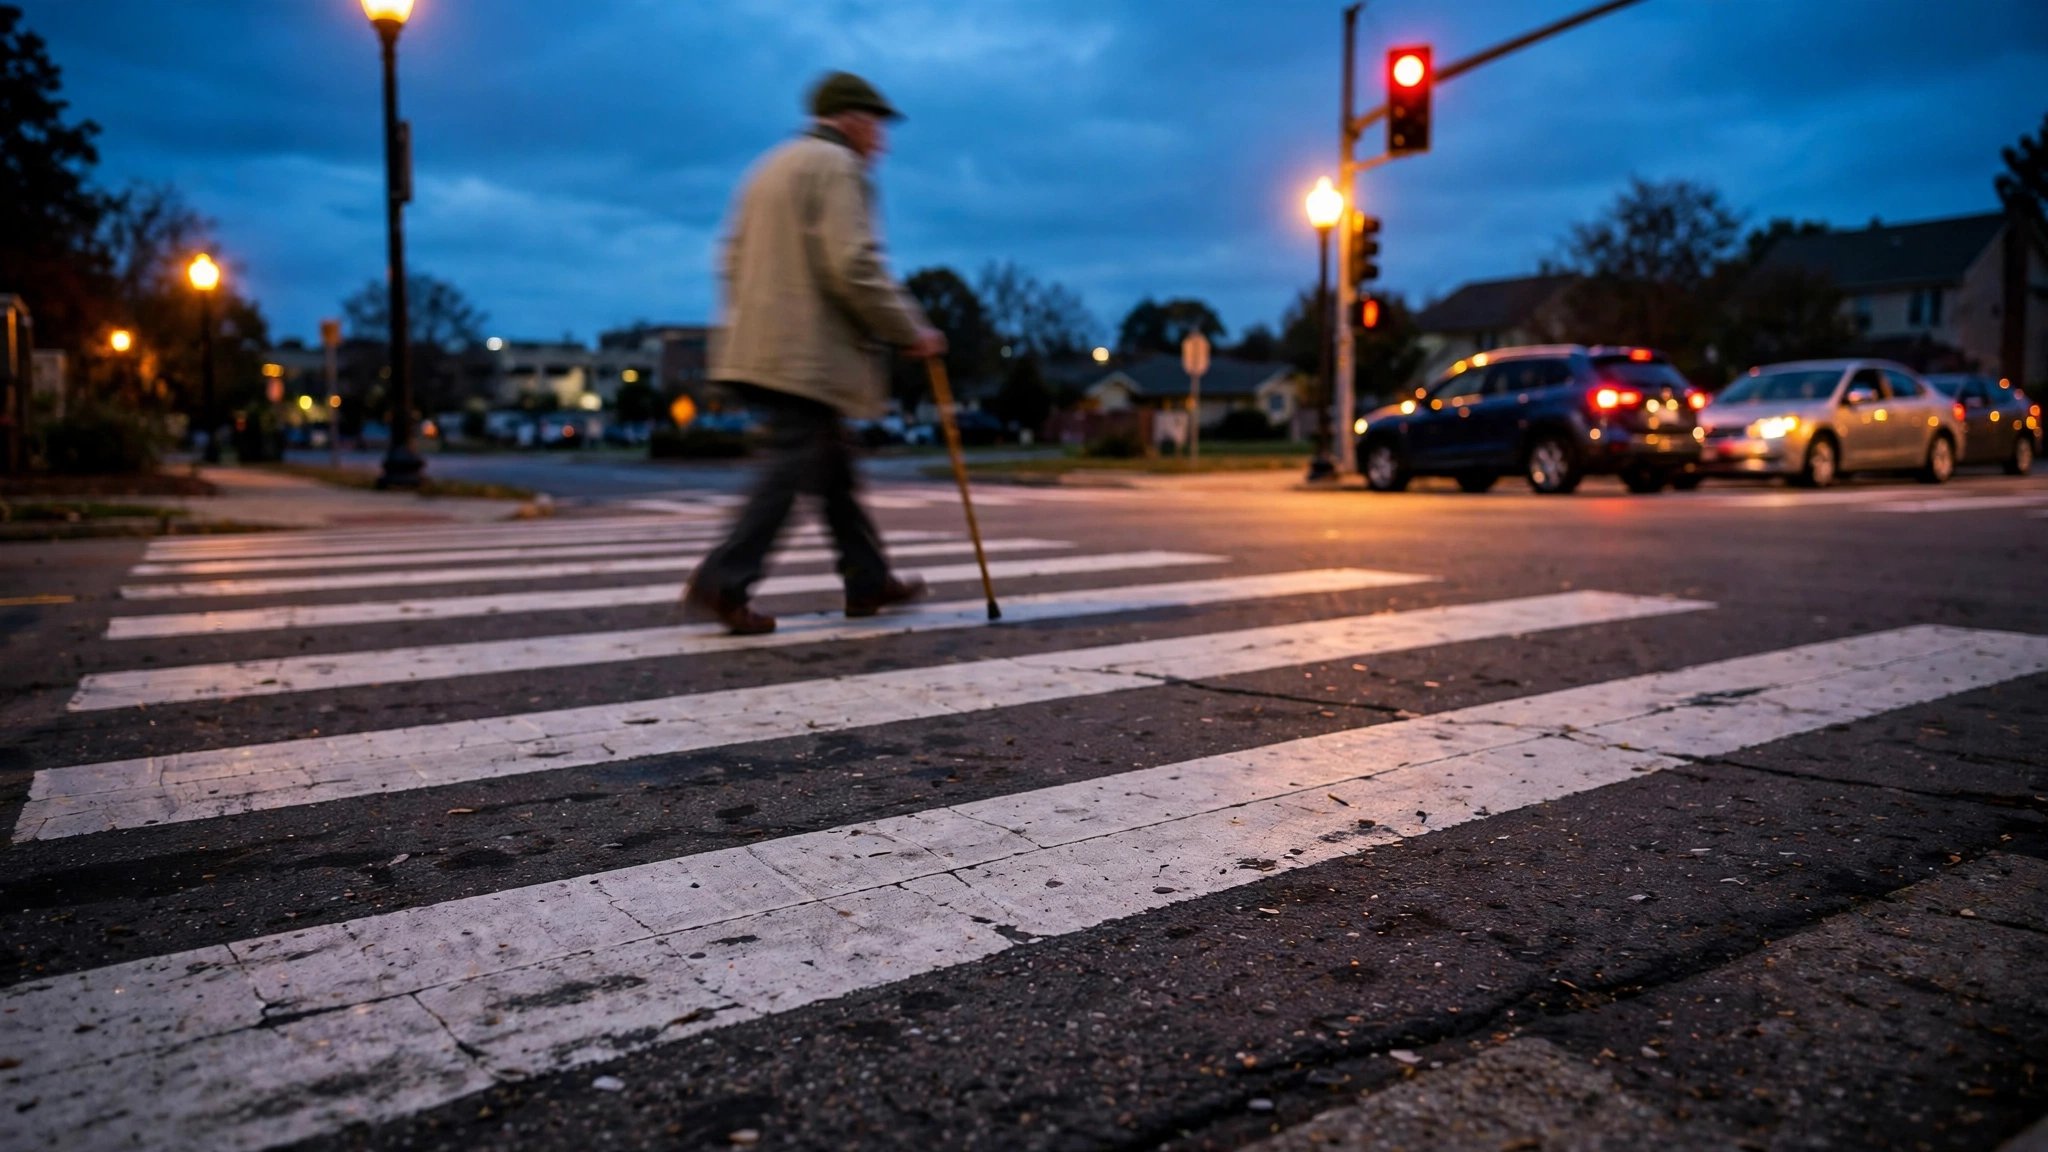
What you can do: If a parent or grandparent is still driving, check their vehicle's crash rating at iihs.org/ratings and look into state-level driving fitness assessments through occupational therapy programs, which remain poorly publicized. If an older family member is walking more than driving, the pedestrian fatality data does not support the assumption that ditching the car makes them safer.
Sources & References
- NHTSA National Center for Statistics and Analysis, Traffic Safety Facts: Older Population, 2023 Data. crashstats.nhtsa.dot.gov
- NHTSA, Countermeasures That Work: Older Drivers – Data/Surveillance. nhtsa.gov
- National Safety Council, Injury Facts: Older Drivers Data Details, analysis of NHTSA FARS data. injuryfacts.nsc.org
- NHTSA, 2025 Traffic Death Estimates & 2024 FARS. nhtsa.gov