Your Car Will Be Recalled. The Math Says You Won't Fix It.
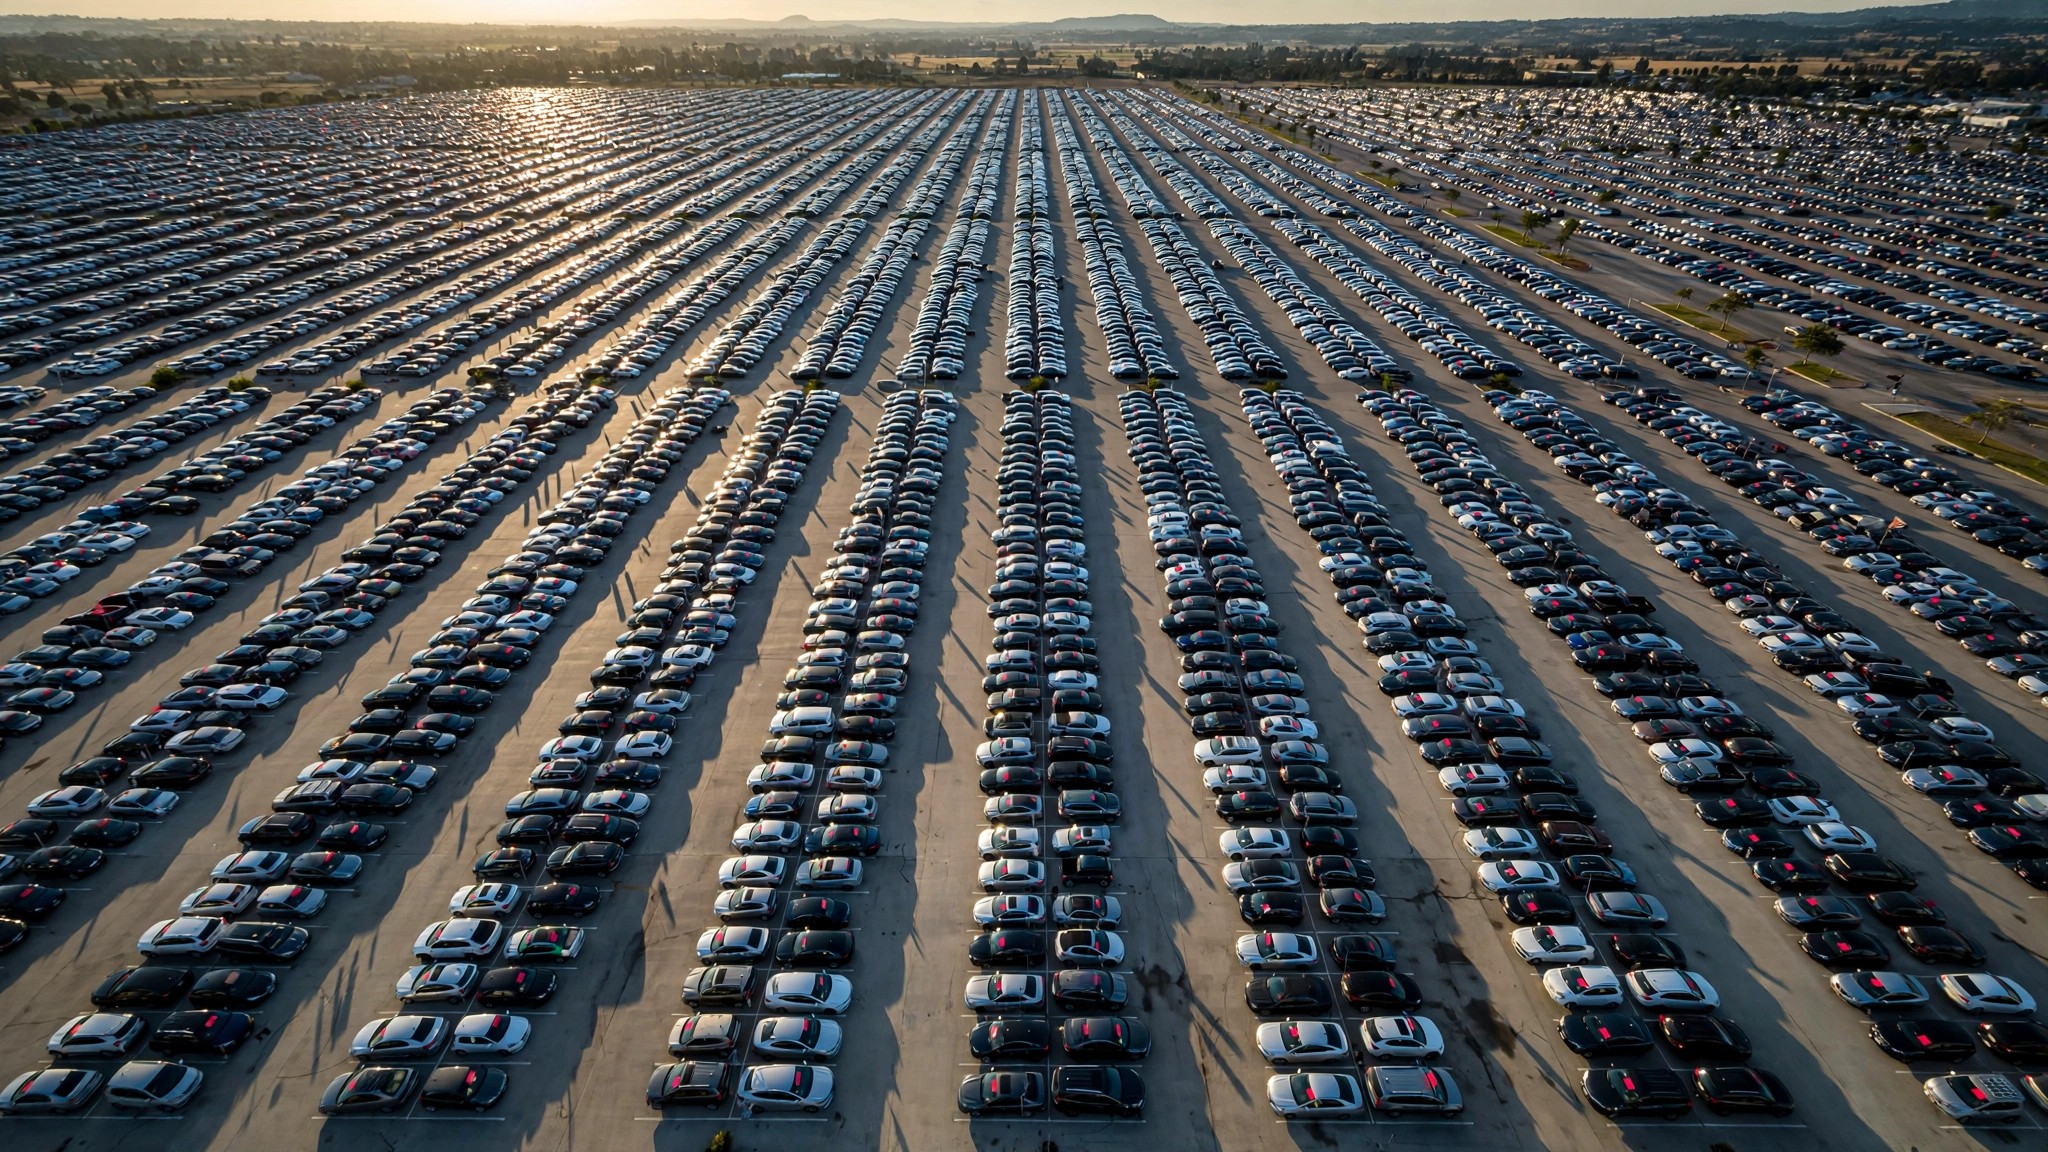
I built a model, and it is not complicated: take 28 million vehicles recalled last year, divide by 290 million registered vehicles on American roads, and you get a 9.7% annual recall probability per vehicle.[1] That is roughly one in ten cars catching a defect notice every twelve months. Now compound it across the average vehicle's 12-year service life using a simple survival function: (1 − 0.097)12. The probability your car escapes its entire existence without a single recall is 29.5%.
Flip it. Seven out of ten vehicles rolling off a dealer lot today will eventually get a letter from someone explaining that something inside was built wrong. Brakes, software, airbags, steering columns, fuel systems, instrument clusters that go dark at 65 mph because two microchips were assigned the same memory address.[2] This week alone delivered 449,000 freshly recalled vehicles across four separate campaigns: Hyundai dashboards blanking mid-drive, Toyota instrument panels failing to display warnings, a batch of Toyota and Subaru EVs whose battery controllers crash themselves into shutdown at highway speed, and a quarter-million Land Rovers with airbag connectors that NHTSA estimates are corroded in 100% of affected units.[3][4][5]
449,000 in seven days. Annualize that and you land at 23.3 million, which is close enough to the 28 million from 2025's official count to suggest this pace is structural, not anomalous.
Now the part where the math turns ugly. Recall Masters' ninth annual State of Recalls report found that 50.3% of vehicles recalled in 2025 had been repaired by February 2026.[1] Call it first-year completion. Industry long-term estimates hover around 70% eventual completion, meaning three in ten recalled vehicles never see a wrench or a software update.[6] Applied to last year's volume: roughly 8.4 million vehicles from the 2025 recall cohort alone will remain unrepaired forever, merging into an accumulated fleet of defective-but-driving cars that stretches back years and numbers in the tens of millions. Carfax has previously estimated that one in four vehicles on the road carries at least one open recall at any given time.
One in four, meaning seventy-two million vehicles, give or take, rolling around with a known manufacturer-acknowledged defect that somebody decided was serious enough to file federal paperwork about but that the owner either never received notice of, received notice of and forgot, or received notice of and actively chose to ignore because the dealership is forty minutes away and the car seems fine.
Software defects now lead the recall taxonomy, and in 2025, 119 NHTSA campaigns covering 8.19 million vehicles traced back to software or electronics failures, beating powertrain defects (87 campaigns, 7.99 million vehicles) for the second consecutive year.[1] This week's four new recalls are a live demonstration: three out of four are software-caused. Digital instrument clusters that reboot, battery ECUs that crash, and dashboard screens that blank are failure modes that did not exist fifteen years ago because a needle on an analog speedometer gauge does not reboot. It does not compete for memory addresses with a head-up display's wiring harness. A physical gauge fails gracefully; a digital screen fails totally and takes every warning indicator with it.
NHTSA's own Office of Defects Investigation logged the asymmetry in its quarterly metrics. Vehicle Owner Questionnaire complaints rose from 16,055 in FY25 Q1 to 20,196 in Q4, a 26% increase in twelve months.[7] Investigations opened per quarter: 10, 8, 5, 10. Flat. Consumer complaints are accelerating while the agency's investigative output remains essentially constant, which means the complaints-per-investigation ratio is widening every quarter. I plotted the trendlines, and they do not converge.
Methodology and limitations: The 9.7% annual per-vehicle recall rate divides total recalled vehicles (28 million) by the US registered fleet (approximately 290 million per FHWA estimates). This assumes uniform distribution across the fleet, which is false: newer vehicles are recalled more often than older ones, and some manufacturers are recalled disproportionately. The 12-year lifespan uses Bureau of Transportation Statistics median vehicle age estimates. The survival function assumes independence between years, which is also approximate. A more sophisticated model accounting for vehicle age, manufacturer recall frequency, and model-specific rates would produce a range rather than a point estimate. Carfax's "one in four" figure is an industry estimate without published methodology, though it aligns with a rough steady-state calculation given annual inflows of 8–10 million unrepaired vehicles against natural fleet attrition through scrapping and salvage. We cannot determine from FARS whether fatally crashed vehicles had outstanding recalls at the time of impact, which would be the dispositive dataset, but it does not exist in public form.
Strongest counterargument: A high recall volume is partially a feature, not a bug. Manufacturers that detect and report defects proactively are preferable to those that bury them. NHTSA's expanding recall count also reflects post-Takata regulatory seriousness and industry adoption of connected-vehicle telemetry that surfaces issues earlier. Furthermore, not all recalls carry equal risk: a dashboard that blanks for two seconds and self-recovers is not the same hazard as an airbag that may not deploy in a collision, and aggregating them into a single per-vehicle probability obscures meaningful variation in severity. The 50.3% first-year completion rate also represents a historic high for a first-year cohort, suggesting the system is improving, not deteriorating, on the response side even as the input volume grows.
What you should do: Go to nhtsa.gov/recalls and enter your VIN; it takes ninety seconds and searches every open recall in the federal database. Do it for every vehicle in your household. The probability that at least one of them has an outstanding recall right now, if you own two cars with an average age of six years, is approximately 44%, derived from the complement of both cars having escaped recall at the per-vehicle annual rate. These are not exotic odds; this is a coin flip dressed up as a letter you probably threw away.
Sources & References
- Recall Masters, 2025 State of Automotive Recalls Report, May 2026. 447 NHTSA campaigns + 223 voluntary notices, 28M+ vehicles, with first-year completion at 50.3% and software/electronics leading at 119 campaigns covering 8.19M vehicles. einpresswire.com
- NHTSA Recall 26V393000, Toyota bZ/Lexus RZ/Subaru Solterra ECU memory conflict, 20,991 vehicles, June 2026. nhtsa.gov
- NHTSA Recall, Hyundai Tucson/Tucson Hybrid/Tucson PHEV instrument cluster software reset, 96,310 vehicles, June 2026. nhtsa.gov
- NHTSA Recall 26V341000, Toyota/Lexus instrument panel cluster combination meter, 81,893 vehicles, June 2026. nhtsa.gov
- NHTSA Recall, Land Rover Defender/Discovery/Range Rover airbag clockspring corrosion, 250,857 vehicles, June 2026. nhtsa.gov
- NHTSA, 2025 Recalls Annual Report. 80% of recalls have remedy within 60 days. nhtsa.gov
- NHTSA Office of Defects Investigation, Quarterly Metrics FY2025. VOQ complaints rose from 16,055 in Q1 to 20,196 in Q4 while investigations held flat at 10, 8, 5, and 10 per quarter. nhtsa.gov
Source: Recall Masters 2025 State of Recalls, NHTSA 2025 Annual Recall Report, NHTSA ODI Quarterly Metrics FY2025, FHWA registered vehicle estimates. Per-vehicle probability model uses simplifying assumptions of uniform distribution and annual independence; actual individual risk varies by vehicle age, make, and model; see methodology for caveats.