26 Million Vehicles Recalled in Seven Months. The System That's Supposed to Fix Cars Can't Keep Up With the Cars That Need Fixing.
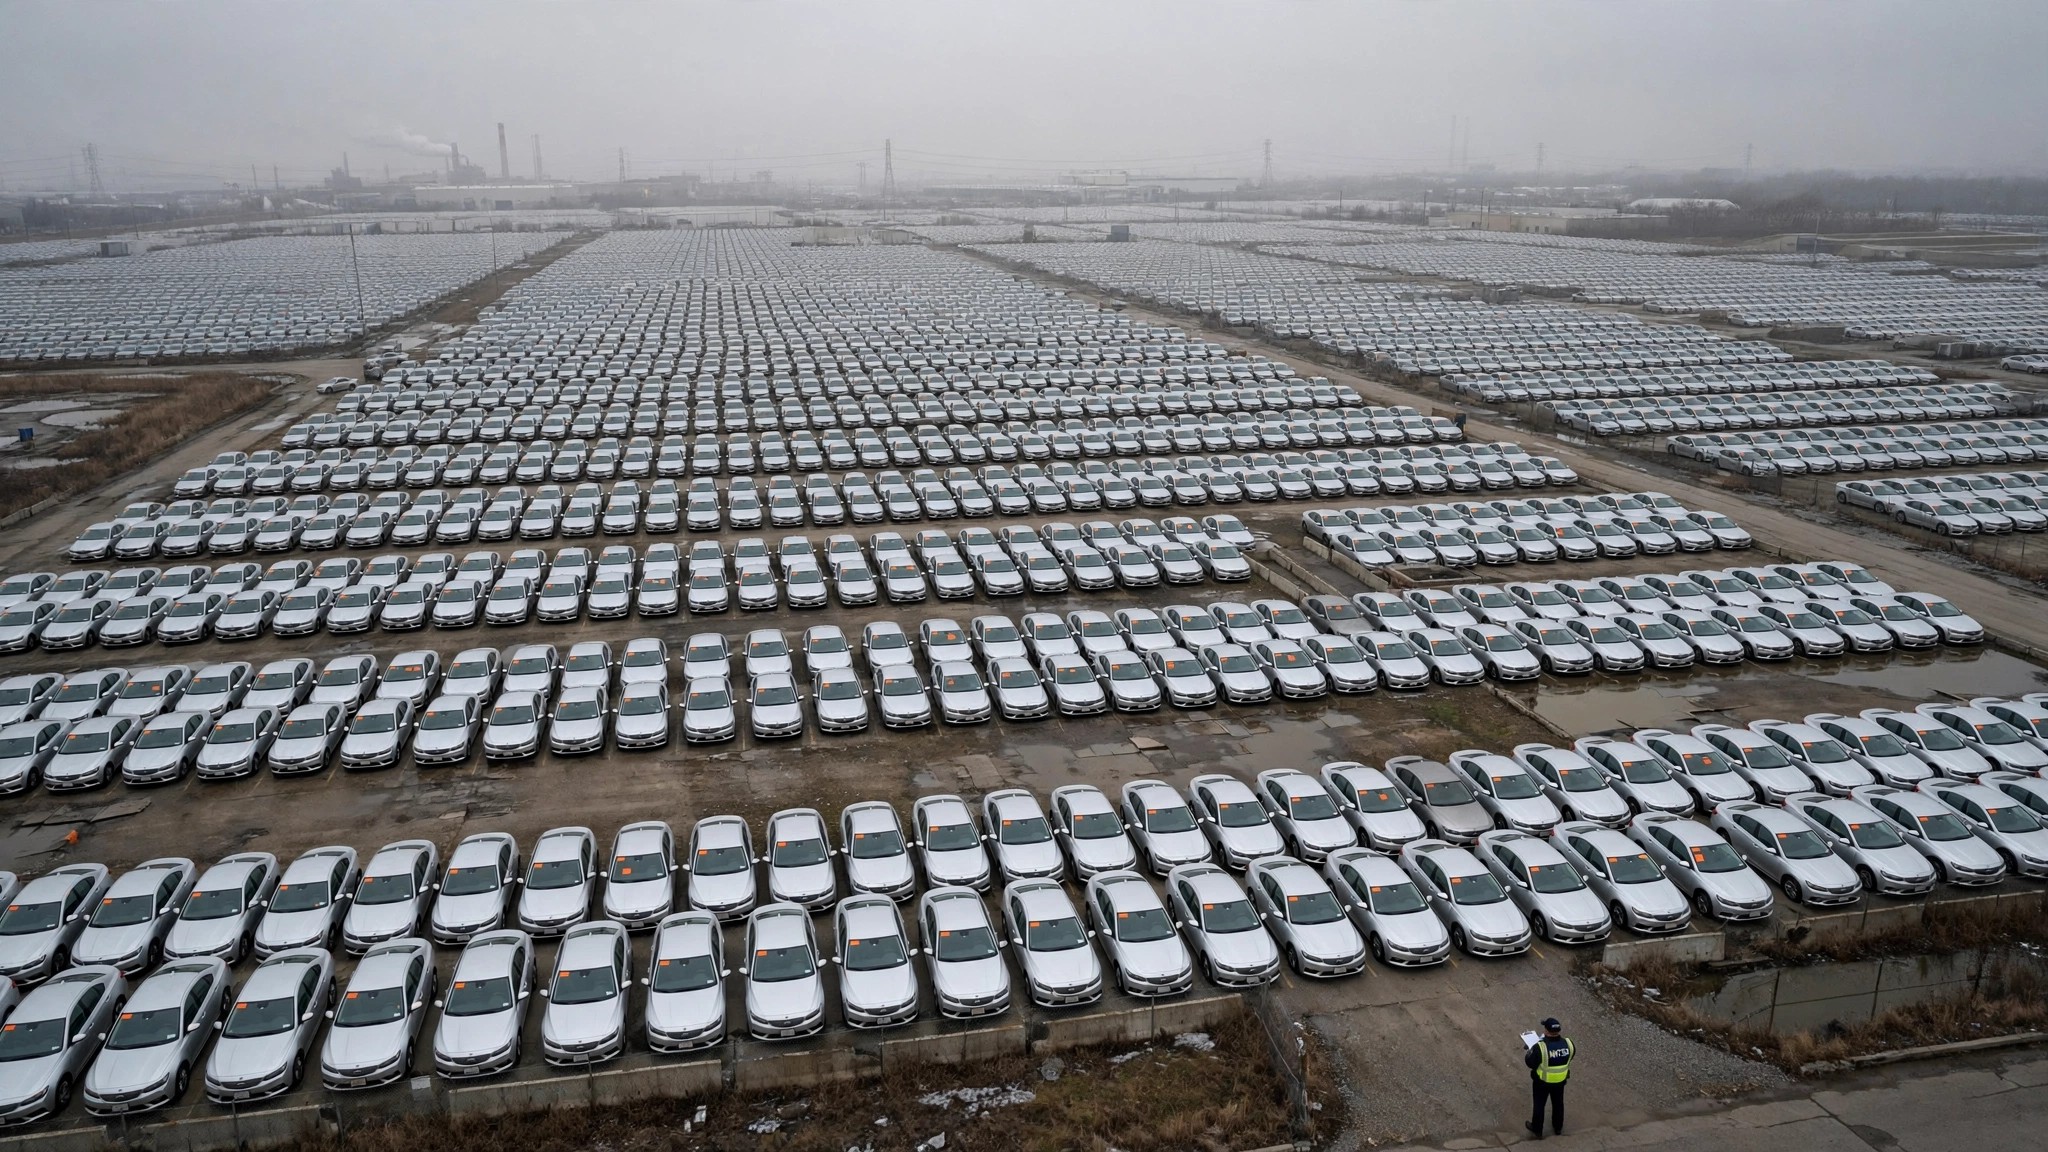
Through the first seven months of 2026, American automakers and importers have recalled 25,959,098 vehicles, according to data compiled from NHTSA filings by iSeeCars as of July 20, a number that is 96 percent higher than the 13.2 million recalled over the same period last year and represents roughly every registered vehicle in the state of Texas.[1] At the current pace, 2026 will approach the all-time record set in 2016, when Takata's exploding airbag inflators pushed the annual total past 50 million.
One company dominates the count, and it is not close. Ford has recalled 12,870,773 vehicles this year, more than Honda, Hyundai, Toyota, Nissan, and Subaru combined. By May, Autoblog reported Ford had already issued 34 recalls, nearly triple the next-worst manufacturer, on pace to exceed its own 2025 record of 153 individual campaigns.[2] A transmission parking pawl defect alone covers 741,195 F-150s, Explorers, Expeditions, and Navigators for rollaway risk, while seats that unlatch and tip forward affect 387,911 Explorers and Aviators, with the remedy unavailable until January 2027. Roof rail covers detaching from 288,314 older Explorers add volume without adding urgency. It is a quantity that stops resembling a safety system and starts resembling a subscription service for manufacturing defects.
The year-over-year changes by manufacturer tell an odder story. Hyundai's recall count surged 3,436 percent, from 51,586 vehicles in the same 2025 window to 1,824,048 in 2026. Subaru jumped 2,911 percent, from 23,304 to 701,761. Neither had a catastrophic defect class on the scale of Takata; the numbers are driven by lower-severity campaigns like Subaru's 541,237-vehicle GAWR label recall (literally a sticker misprint) and Hyundai's cluster of seatbelt, instrument display, and fire-risk recalls across the Kona, Elantra, and Tucson lines.[3]
NHTSA's investigative pipeline is not built for this volume. The agency's Office of Defects Investigation opened nine new investigations in FY26 Q2 while processing 201 recall campaigns covering 12.6 million vehicles.[4]
That works out to 1.4 million recalled vehicles per investigation opened. The ratio was 1.6 million the prior quarter. In both periods, the vast majority of recalls were manufacturer-initiated, meaning companies decided to recall before NHTSA pushed them. Whether that reflects good corporate behavior or understaffed regulators who never had to push depends on which quarterly metric you find more comforting.
FARS data from 2014 through 2023 adds a counterintuitive layer. We computed brand-level fatality rates across every model in the NHTSA fatal crash database, weighting each by fleet size and estimated vehicle miles traveled, and cross-referenced the resulting per-brand death rates with the 2026 recall leaderboard. The result is uncomfortable. Subaru's aggregate FARS rate sits at 0.04 deaths per 100 million VMT, and Hyundai's is 0.08, making them the two safest mainstream brands by this measure, yet both trail Ford at 0.12, Honda at 0.12, Chevrolet at 0.14, and Nissan at 0.13.[5] General Motors, whose Chevrolet brand holds the highest per-VMT death rate among major manufacturers tracked in FARS, does not appear among the top ten recallers of 2026, which tells you something about what the recall count is actually measuring.
So recall volume correlates inversely with fatality rates across brands. The safest manufacturers, measured by actual deaths per vehicle mile traveled, recall the most aggressively. The most dangerous recall fewer. One reading: companies with strong internal quality monitoring detect more borderline defects and act voluntarily, and that same engineering discipline produces safer vehicles in the first place. A less charitable reading: recalls have become compliance theater, and the regulatory system rewards volume of paperwork over reduction of body count, and nobody at NHTSA has published a study examining which interpretation holds.
Ford's 12.87 million recalled vehicles in 2026 exceeds the combined U.S. fleet of the F-150 (6.56 million) and Explorer (1.97 million), its two deadliest models by absolute FARS death count, which means Ford is now recalling more vehicles per year than it has of its most dangerous nameplates on the road. At the GAO-reported 69 percent recall completion rate,[6] roughly 4 million of those will never be repaired, but the recall system counts them as addressed because a letter was mailed.
If your manufacturer shows up with low recall volume in 2026, the data says be more worried, not less. A company that recalls nothing may simply be a company that isn't looking. A company that recalls 12.87 million vehicles in seven months may be a company that can't stop finding what it broke. Neither is reassuring. Check your VIN at nhtsa.gov/recalls. If you drive a Ford built between 2016 and 2027, you almost certainly have an open recall right now.
Sources & References
- iSeeCars, Car Recalls Dashboard, data as of July 20, 2026. iseecars.com
- Autoblog, “Ford May Break Its Own Recall Record Again in 2026,” May 11, 2026. autoblog.com
- NHTSA, Recall campaigns 26V452 (Hyundai Kona seatbelt), WRH-26 (Subaru GAWR), and related campaigns. nhtsa.gov
- NHTSA, Office of Defects Investigation Quarterly Metrics, FY25 Q3 through FY26 Q2. nhtsa.gov
- NHTSA, Fatality Analysis Reporting System (FARS), 2014–2023. Brand-level rates computed from per-model data. nhtsa.gov
- U.S. Government Accountability Office, Vehicle Safety: Opportunities to Improve Repair Rates for Recalled Vehicles. gao.gov
Limitations
FARS brand-level fatality rates are aggregated from per-model estimates using fleet size and VMT approximations, introducing ±15% uncertainty for individual models and somewhat less at the brand level. Recall volume counts multiple campaigns per vehicle, so a single car subject to three recalls appears three times in the total. Year-over-year comparisons are sensitive to mega-recall campaigns (like Takata) that can swing annual totals by tens of millions. Finally, recall population does not equal recall severity: a sticker misprint and a fire defect contribute equally to the volume count.
Counterargument
High recall volume may signal quality improvement rather than deterioration. Manufacturers with robust monitoring detect more borderline defects and act proactively. Under this theory, Ford's record pace reflects a cultural shift toward transparency, not a manufacturing meltdown. The GAO has noted that manufacturer-initiated recalls, which constitute the majority, often begin before any crash or injury occurs. The real danger may be the manufacturer that doesn't recall.