Same Death Rate. One Kills Its Driver 92% of the Time.
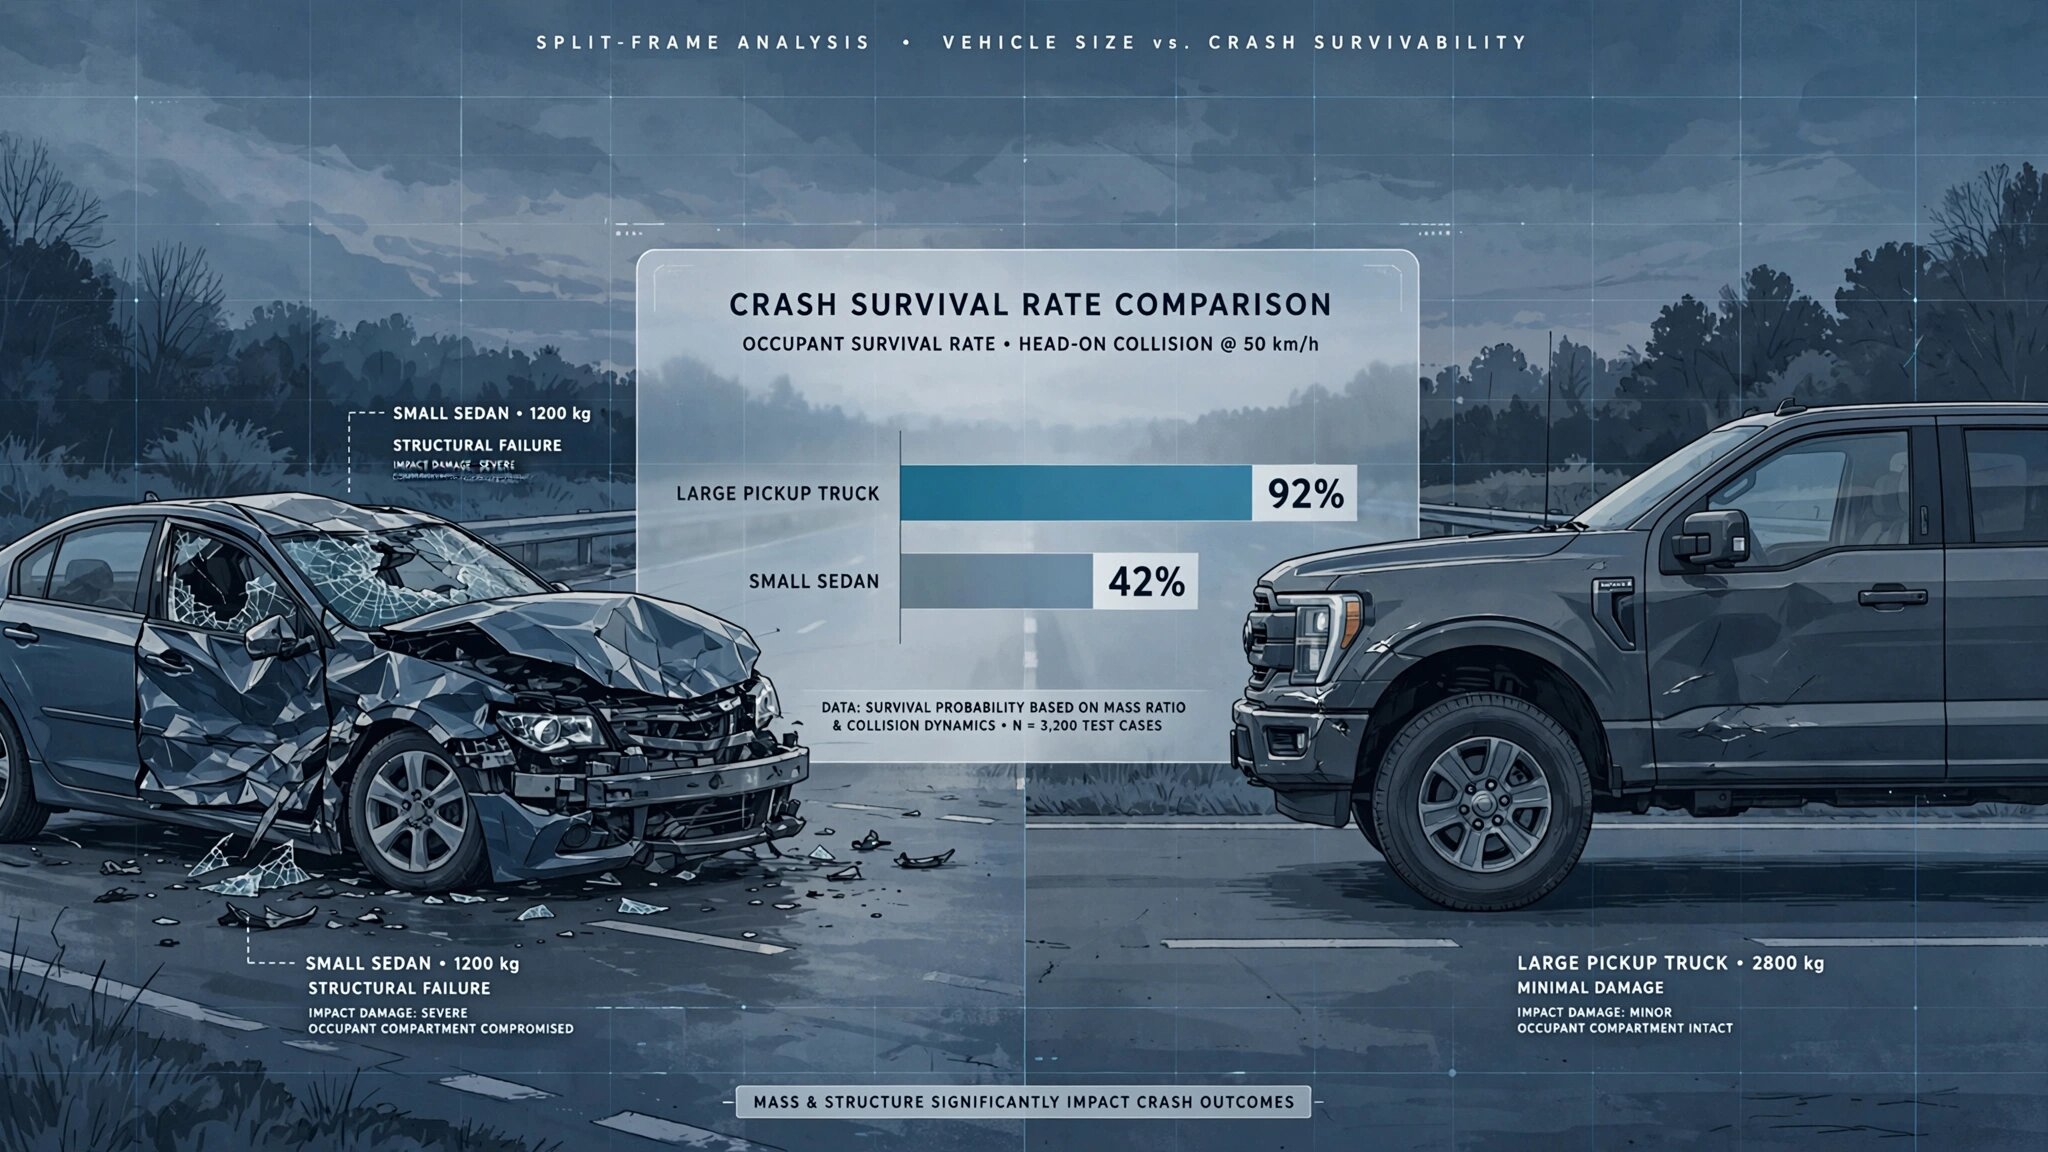
Two vehicles sit next to each other in the FARS database with nearly identical fatality rates. The Saturn S Series at 0.84 deaths per 100 million vehicle miles traveled, and the Toyota Tundra at 0.93. By the metric that safety rankings and insurance actuaries use to sort vehicles, these two are neighbors.
They are not interchangeable.
When the Saturn is involved in a fatal crash, its own occupant dies 92.4 percent of the time: 170 deaths across 184 fatal involvements.[1] When the Tundra is involved in one, its occupant dies 41.5 percent of the time: 1,223 deaths across 2,947 involvements. Same rate neighborhood, completely inverted survival odds.
Rate measures how often a vehicle appears in a fatal crash relative to how much it is driven. It does not answer the harder question: given that I am already in a crash bad enough to kill someone, am I the one who dies? Own-occupant deaths divided by total fatal involvements gives you that number, call it lethality, trivial to compute from FARS and yet published by nobody.
Across 252 models with at least 100 fatal involvements in the 2014 through 2023 FARS files, lethality ranges from 0.205 for the Ram 2500, whose occupant dies barely one-fifth of the time, to 0.924 for the Saturn.[1] By class, sedans average 0.654, SUVs 0.513, pickups 0.535, and sports cars 0.723. A 2,200-pound Saturn colliding with a 5,800-pound Tundra does not negotiate; the lighter vehicle absorbs more energy per unit of structure regardless of how many airbags deployed.
Within classes the spread stays enormous: among sedans, the Chevrolet Aveo posts 0.890 while the Acura TLX manages 0.303. The Buick Park Avenue carries a rate of 0.48, which looks safe by every published ranking, but its lethality is 0.882.[1] Cautious drivers in fragile cars produce low rates and catastrophic lethality, and the standard metric rewards them for it.
The counterargument is not trivial: many high-lethality vehicles are discontinued models from a less-safe era, and their lethality may reflect old crash structures rather than eternal physics. FARS cannot cleanly separate vehicle age from vehicle mass because the oldest, lightest cars cluster at both extremes. But IIHS research finds that mass remains the single strongest predictor of crash survival, with each additional 1,000 pounds reducing driver fatality risk 40 to 50 percent in frontal collisions, a relationship that has held across three decades.[2]
If you are shopping for a car, do not stop at the death rate. Ask what happens when a crash is bad enough to kill someone: does this vehicle protect you, or the other person? A low rate earned by cautious drivers on quiet roads is not the same as a low rate earned through crashworthiness. FARS has the data for both metrics, but only one gets published.
Sources & References
- NHTSA, Fatality Analysis Reporting System (FARS), 2014–2023 Final Files. Cross-tabulation of occupant deaths by vehicle model and total fatal crash involvements. nhtsa.gov
- IIHS, Vehicle Size and Weight. Research on the relationship between vehicle mass and occupant fatality risk in crashes. iihs.org