The Ram 2500 Is in 748 Fatal Crashes. Its Occupants Die in 153 of Them.
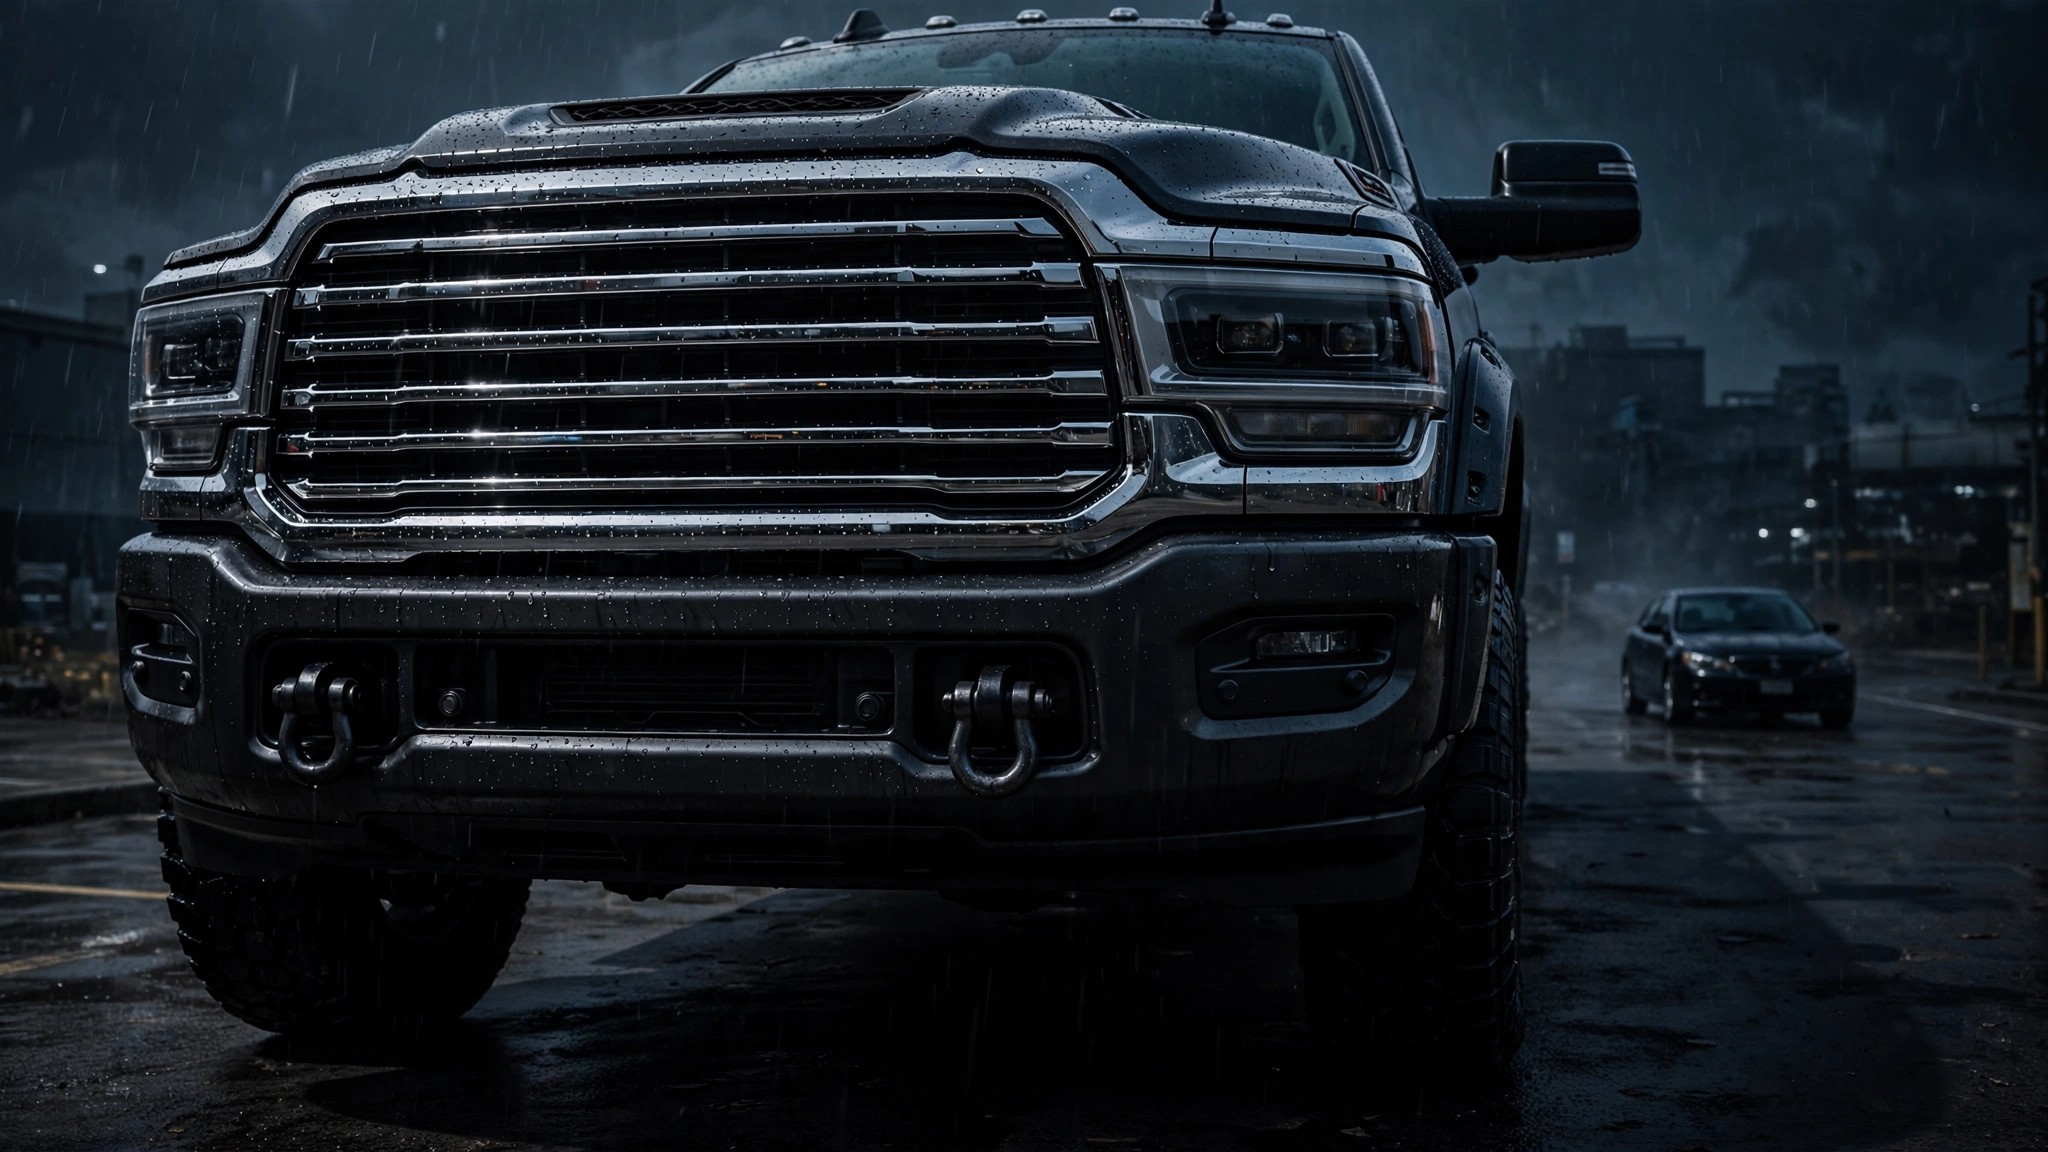
Buried in the FARS database is a metric nobody bothers to calculate, one that tells you something the five-star safety ratings never will. Divide a vehicle’s occupant deaths by the number of fatal crashes it appears in and you get what I’m calling the lethality export rate: when this vehicle is in a fatal crash, who actually dies?
For the Ram 2500, the answer is almost never the Ram’s occupant. Out of 748 fatal crashes involving a Ram 2500 between 2014 and 2023, only 153 killed someone inside the Ram, while the remaining 595 deaths happened to the people in the other vehicle, on the bicycle, on the sidewalk. Four out of five dead people were not Ram occupants but rather whoever had the misfortune of sharing the road with 7,300 pounds of steel moving at highway speed. That is not a safety feature. That is an externality wearing a chrome grille.
What makes this finding genuinely unsettling is how cleanly the gradient tracks vehicle mass, as if the physics department wrote the actuarial tables. Drop from the Ram 2500 to the Ford F-250, roughly 800 pounds lighter, and the export rate falls to 63.6%. At around 4,500 pounds the F-150 exports 54.2% of its crash deaths to other parties, and the Silverado sits at 51.4%, just barely tipping over the halfway mark where a vehicle kills more outsiders than its own occupants. Every single full-size pickup in the FARS dataset exports more death than it absorbs.
Run the numbers across all 85,128 fatal crashes involving pickups over the decade and the class-level picture crystallizes into something no individual model review can capture. Pickup occupants account for 41,593 deaths while other parties account for 43,535, meaning the pickup truck segment kills more people outside the cab than inside it. Sedans invert that ratio completely: 89,127 of their own occupants dead versus 49,027 other-party deaths across 138,154 fatal crashes, absorbing far more lethality than they radiate outward.[1]
Now consider what happens at the opposite end of the mass spectrum, where the physics of crash survival reverse polarity entirely. A Chevy Spark is involved in 695 fatal crashes over the same period and kills 517 of its own occupants, yielding an export rate of just 25.6% because three out of four deaths belong to the Spark driver or their passengers. By no conventional measure is it a safe car, but it has the structural decency to keep its danger mostly contained within its own crumple zones rather than transferring it outward through kinetic energy and mass advantage.
IIHS has documented for years that in two-vehicle crashes, the lighter vehicle’s occupants bear disproportionate risk, a finding so well-established it barely qualifies as news.[2] What nobody quantified until now is the per-model export rate across the entire decade of FARS data for every vehicle with sufficient crash volume, and the class averages tell the story with uncomfortable clarity: pickups and SUVs export roughly 48% of their crash deaths to others, sedans export 35%, and sports cars export just 31%, mapping almost perfectly onto curb weight as if someone drew a regression line through the morgue data and found an R-squared that would make a statistics professor uncomfortable.
Here is where the strongest counterargument deserves its full voice, because dismissing it would be dishonest about a complicated problem that resists clean narratives. Heavy-duty pickups exist because people haul 14,000-pound fifth wheels on I-80, pull horse trailers through mountain passes, and load construction materials at job sites where a sedan would be useless. Their mass is functional rather than cosmetic, and FARS cannot distinguish a Ram 2500 towing a backhoe from one commuting solo to Target, which matters because the risk profile of those two use cases is fundamentally different in ways the data cannot decompose. It is also entirely plausible that the Ram’s mass prevents some crashes from becoming fatal at all, creating a survivability dividend that this data, which only records events where at least one person died, simply cannot capture.
Those points are valid. But 79.5% is not a rounding error produced by small sample noise, and the gradient from Ram 2500 to Spark is too clean, too consistent across makes and model years, to dismiss as statistical artifact. Mass protects occupants and endangers everyone else in almost perfect proportion across the entire dataset, a relationship that holds whether you are looking at Stellantis, Ford, GM, or Toyota trucks. For a decade the Ram 2500 has been privatizing its safety benefits while socializing the cost, and that cost is denominated in other people’s lives.
What to do with this: If you drive a heavy-duty pickup for work, understand that the survival margin you enjoy comes directly from the person in the sedan next to you, and drive with that asymmetry consciously in mind rather than trusting mass alone to solve the safety problem. If you are shopping for a vehicle and weight factors into your decision, check the IIHS vehicle size and weight page[2] and recognize that “safe for me” and “safe for everyone” are questions with very different answers that the window sticker does not distinguish. NHTSA’s proposed pedestrian head protection standard[3] tackles front-end geometry but does not touch the mass asymmetry problem directly, and until someone does, the export rate remains a permanent feature of the American road rather than a bug anyone is working to fix.
Sources & References
- NHTSA, Fatality Analysis Reporting System (FARS), 2014–2023. Per-model occupant deaths and crash counts cross-tabulated by the author. nhtsa.gov
- IIHS, Vehicle Size and Weight. “In crashes between two vehicles, the driver of the lighter vehicle is at greater risk.” iihs.org
- NHTSA, NPRM: Pedestrian Head Protection Standard (FMVSS No. 228), September 2024. Proposed front-end design requirements for pedestrian safety. nhtsa.gov