Pickups Got 9% Safer Last Year. SUVs Got Deadlier. NHTSA Reports Them as the Same Category.
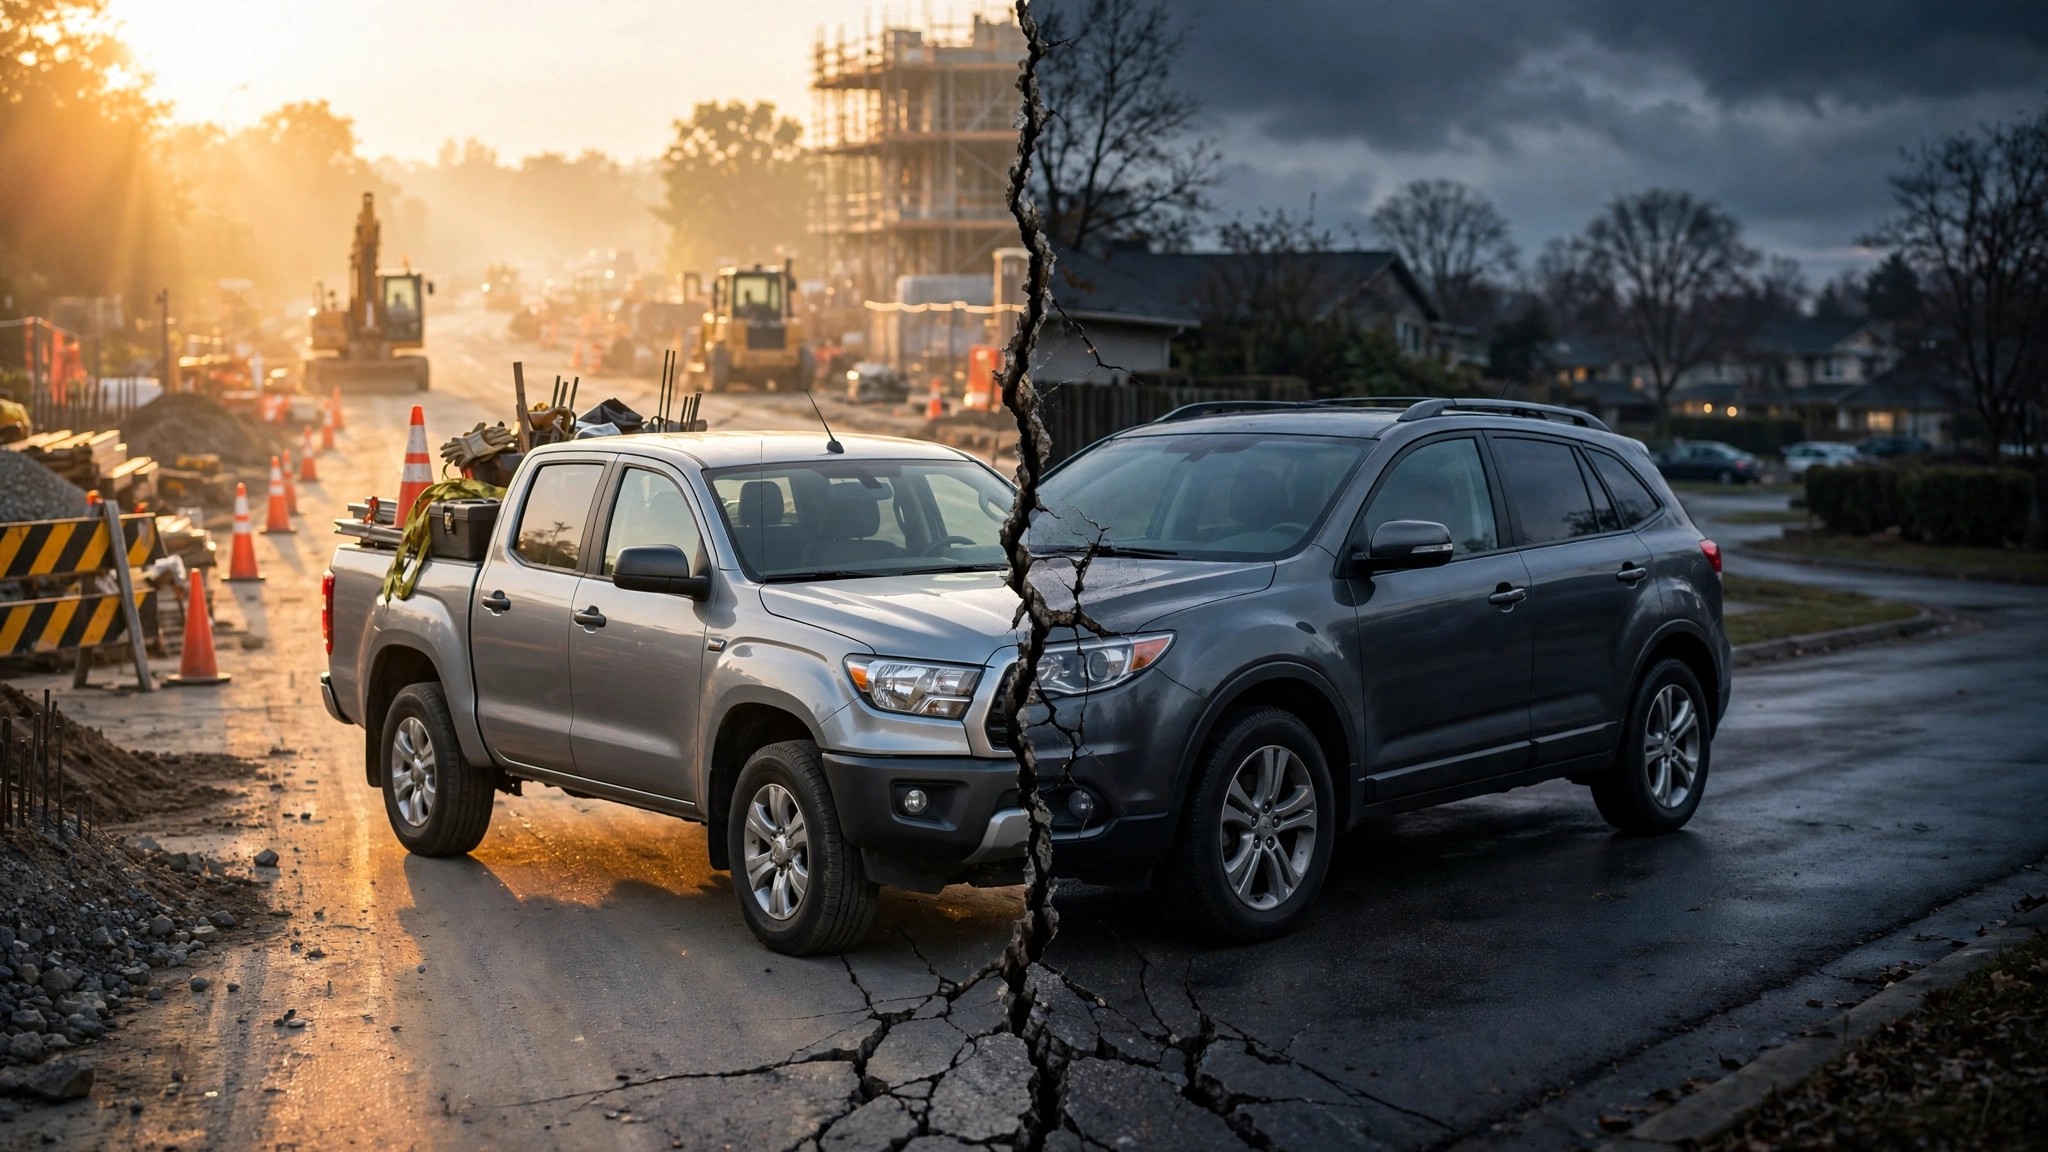
NHTSA's April 2026 annual report gives you a single line for "light trucks." It says occupant fatalities dropped 1.2 percent and injuries ticked up 0.3 percent. Looks flat. Sounds boring. Move along.
Except that line contains two vehicle types moving in opposite directions at speed.
Pickup occupant injuries plummeted from 240,323 to 218,231 in 2024, a 22,092-person drop that NHTSA flagged as statistically significant. Meanwhile, SUV occupant injuries climbed from 694,288 to 723,240, adding nearly 29,000 people to hospital intake sheets. (NHTSA did not flag that increase as statistically significant, but it did not flag it as noise, either.) Net result? Light truck injuries "increased 0.3 percent." Technically true. Functionally useless.[1]
The death data is worse. Pickup occupant fatalities fell 4.9 percent, from 4,321 to 4,111. SUV occupant fatalities rose 1.6 percent, from 6,901 to 7,013. That makes SUVs the only vehicle category in the entire 2024 FARS dataset where the body count went up. Not passenger cars (down 9.7%). Not motorcycles (down 2.2%). Not pedestrians (down 3.9%). SUVs. The vehicle Americans buy more than any other body style.[1]
When you net the two against each other inside the "light truck" classification, you get a 14-percentage-point injury swing hidden behind a composite number that rounds to zero. That is not a rounding error. That is two populations with diverging risk profiles wearing the same jersey.
Pickups had a rough decade. The Silverado and F-150 combine for 18,785 fatalities in our FARS dataset, the two highest body counts of any vehicles in America. But the 2024 trend says something changed. Fleet turnover in the construction and commercial sector, driven partly by Section 179 depreciation incentives, is cycling out pre-ESC and pre-AEB trucks faster than the consumer market cycles out ten-year-old Highlanders. The work-truck buyer replaces on a schedule. The family-SUV buyer replaces when the loan is paid off.[2]
NHTSA's own report buries Table 3 on page 5 and breaks out SUVs, pickups, and vans as sub-lines. So the data exists. But the executive summary, the press release, and every headline it generates say "light trucks" and move on. If you are a policymaker trying to decide where to spend enforcement dollars, the composite number tells you nothing is happening. The sub-lines tell you something is very wrong with SUVs and something is finally going right with pickups.
If you drive a pickup built after 2020, the data says your risk is trending down. If you drive an SUV, especially a mid-2010s model without updated crash prevention, the data says you are part of the only vehicle class where 2024 was worse than 2023. Check your VIN at nhtsa.gov/recalls. Then ask why your vehicle's safety trajectory is being reported as a footnote inside someone else's trend.
Sources & References
- NHTSA, Overview of Motor Vehicle Traffic Crashes in 2024, DOT HS 813 791, April 2026. Table 3: Occupants and Nonoccupants Killed and Injured in Traffic Crashes, 2023-2024. crashstats.nhtsa.dot.gov
- NHTSA, FARS 2014-2023 Final File. Per-model fatality and fleet data. nhtsa.gov