America Hit a Record-Low Death Rate. Nine States Got Worse Anyway.
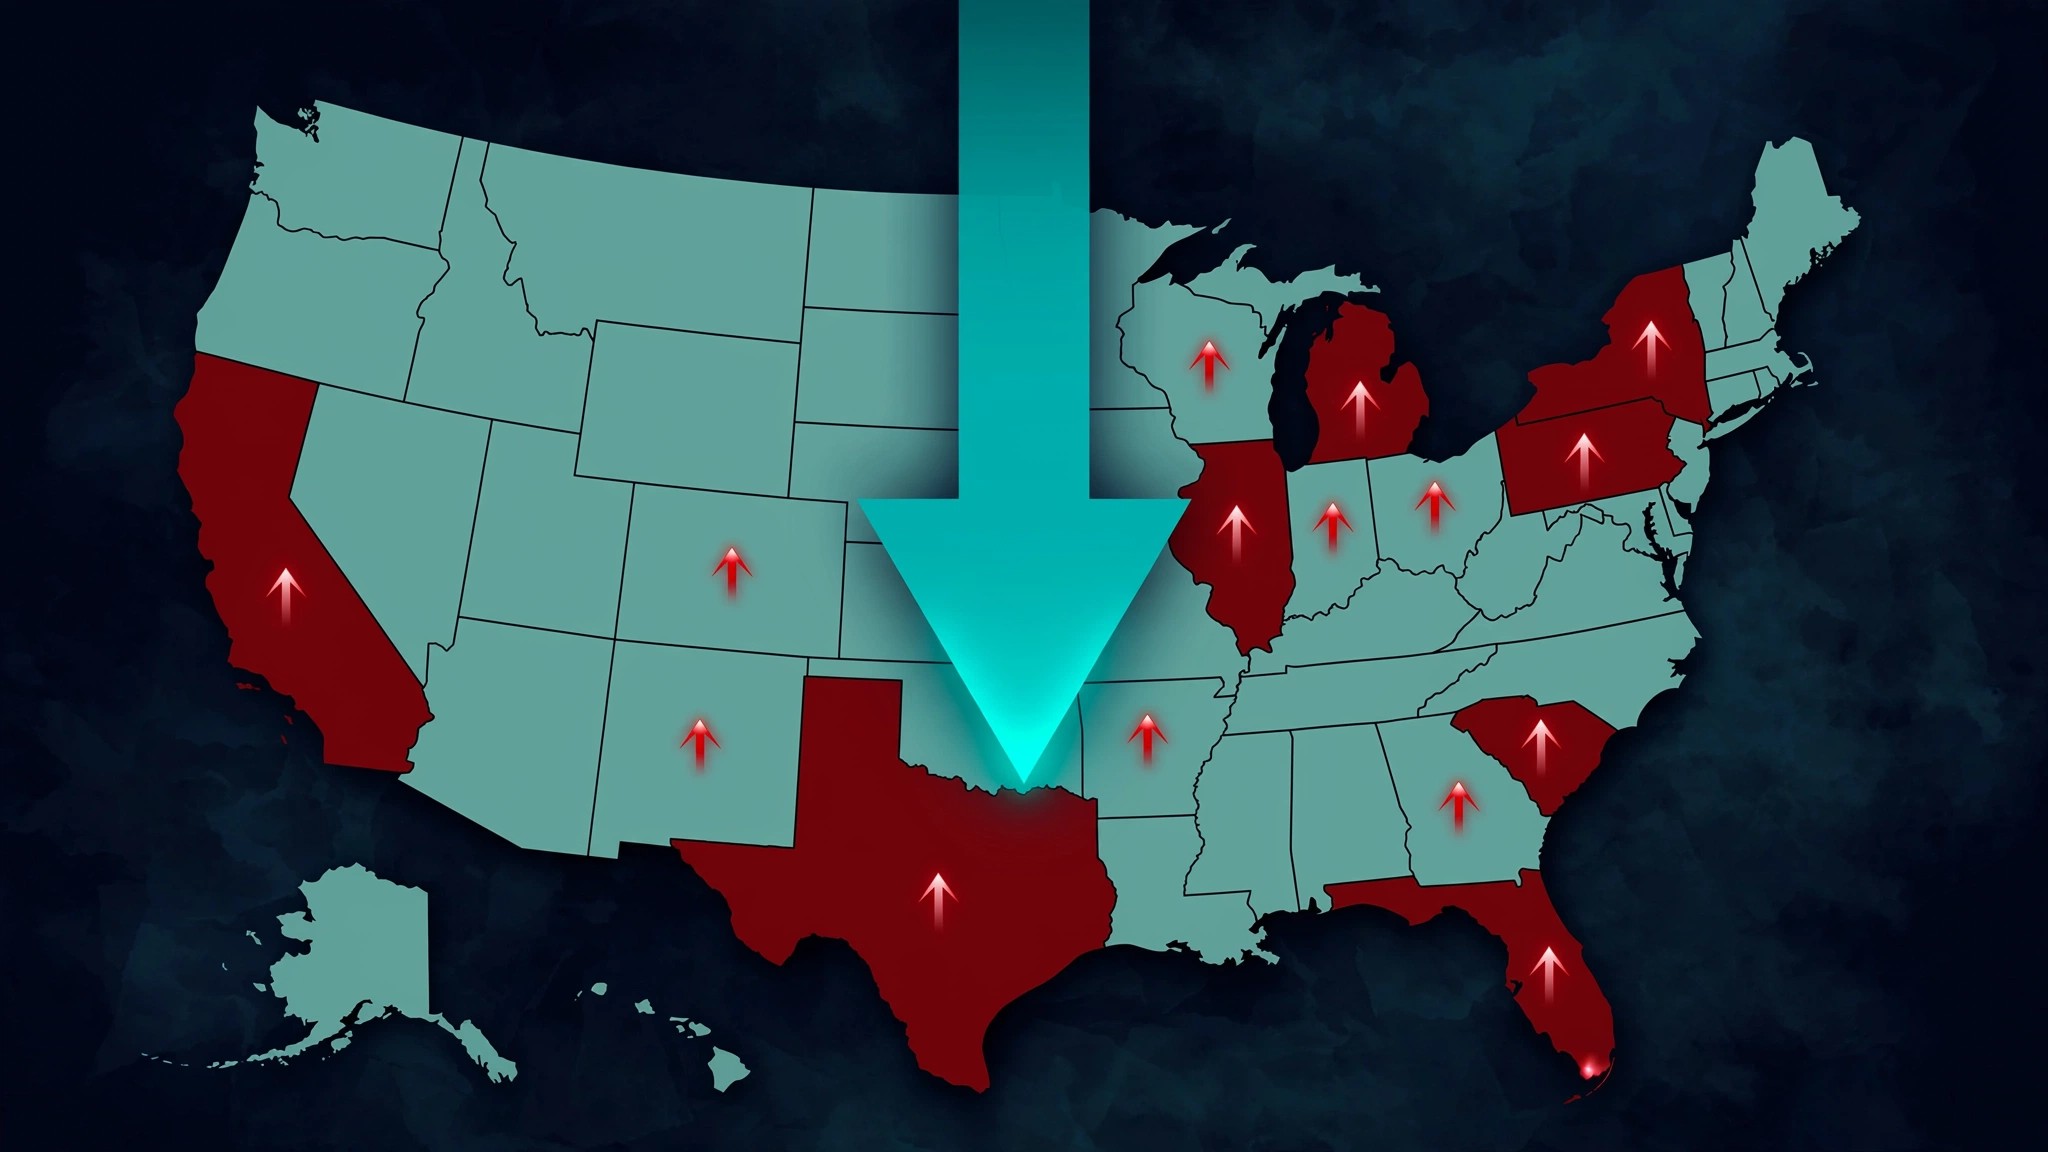
NHTSA published its 2025 early estimate in April: 36,640 traffic deaths, a 6.7% drop, and a fatality rate of 1.10 per 100 million VMT, the second-lowest in the history of the Fatality Analysis Reporting System.[1] The press release led with "39 states improved." It did not dwell on the nine that went the other direction.
Hawaii jumped from 102 deaths to 129. Wyoming from 107 to 124. New Mexico added 49 bodies to reach 458. These are not statistical blips dampened by millions of data points. Hawaii crossed above the national fatality rate for the first time in the dataset period, going from 0.97 to 1.22 per 100 million VMT. An island state with a 60-mph speed limit now kills at a higher rate than the American average.[1]
The full list: Hawaii (+26.5%), Wyoming (+15.9%), New Mexico (+12.0%), Kansas (+8.3%), Idaho (+6.7%), Colorado (+3.8%), Vermont (+3.4%), Louisiana (+2.8%), New Hampshire (+2.3%). Two more states, Illinois and Oklahoma, stayed exactly flat. Combined, the nine added roughly 309 deaths while the other 41 states plus DC and Puerto Rico shed 2,923. The national number improved because the majority overwhelmed the minority, not because the minority was too small to matter.[1]
Pattern-match the nine and three characteristics surface. Five have highway speed limits at or above 75 mph. Six are significantly rural by Census definition, where longer EMS response times and higher impact speeds compound fatality risk.[2] Three (Idaho, Colorado, New Hampshire) sit in the top quintile for population growth, adding VMT faster than road infrastructure can absorb it. New Hampshire remains the only state in America with no adult seat belt law. None of this proves causation. All of it points toward known mechanisms that FARS data has flagged for two decades.
Counterargument, honestly: Small-state statistics are noisy. Hawaii's entire increase is 27 deaths. A single wrong-way driver hitting a van full of people could account for most of that swing. Fair, but that argument also applies to the celebratory side. Rhode Island dropped from 52 to 37. If 27 additional deaths in Hawaii means nothing, 15 fewer deaths in Rhode Island means less. New Mexico (+49) and Colorado (+26) and Louisiana (+21) are not rounding errors.
What to do with this: If you live in one of these nine states, your local risk profile diverged from the national trend. Check whether your state passed or weakened any traffic safety legislation in 2024-2025 at GHSA's state law database. If you drive rural highways in Wyoming, Idaho, or New Mexico, the fatality rate per mile is roughly double the urban rate nationally, and your state just got worse while urban-heavy states improved.[2] Advocate for primary seat belt enforcement if you are in New Hampshire, the statistical outlier that has resisted it for fifty years.
Limitations: 2025 state-level numbers are NHTSA statistical projections using regional estimation methodology, not final FARS crash-by-crash counts. Small states carry high variance; Vermont's +3.4% represents 2 additional deaths. State-level estimates use proportional inflation rates applied regionally. Correlation between speed limits, rural character, and increased deaths does not establish causation. Final 2025 FARS data, expected mid-2027, may revise these figures substantially for low-volume states.
Sources & References
- NHTSA, Early Estimate of Motor Vehicle Traffic Fatalities and Fatality Rate by Sub-Categories in 2025 (DOT HS 813 800), April 2026. Table 3: state-level estimates. crashstats.nhtsa.dot.gov
- NHTSA, Traffic Safety Facts 2023: Rural/Urban Comparison (DOT HS 813 728). Rural areas: 20% of population, 31% of VMT, 41% of fatalities. crashstats.nhtsa.dot.gov
- NHTSA, 2024 FARS Annual Report File and 2025 Press Release. Baseline 2024 state-level fatality counts. nhtsa.gov