The 25,055 Deaths Behind NHTSA’s 2026 Crash Test List
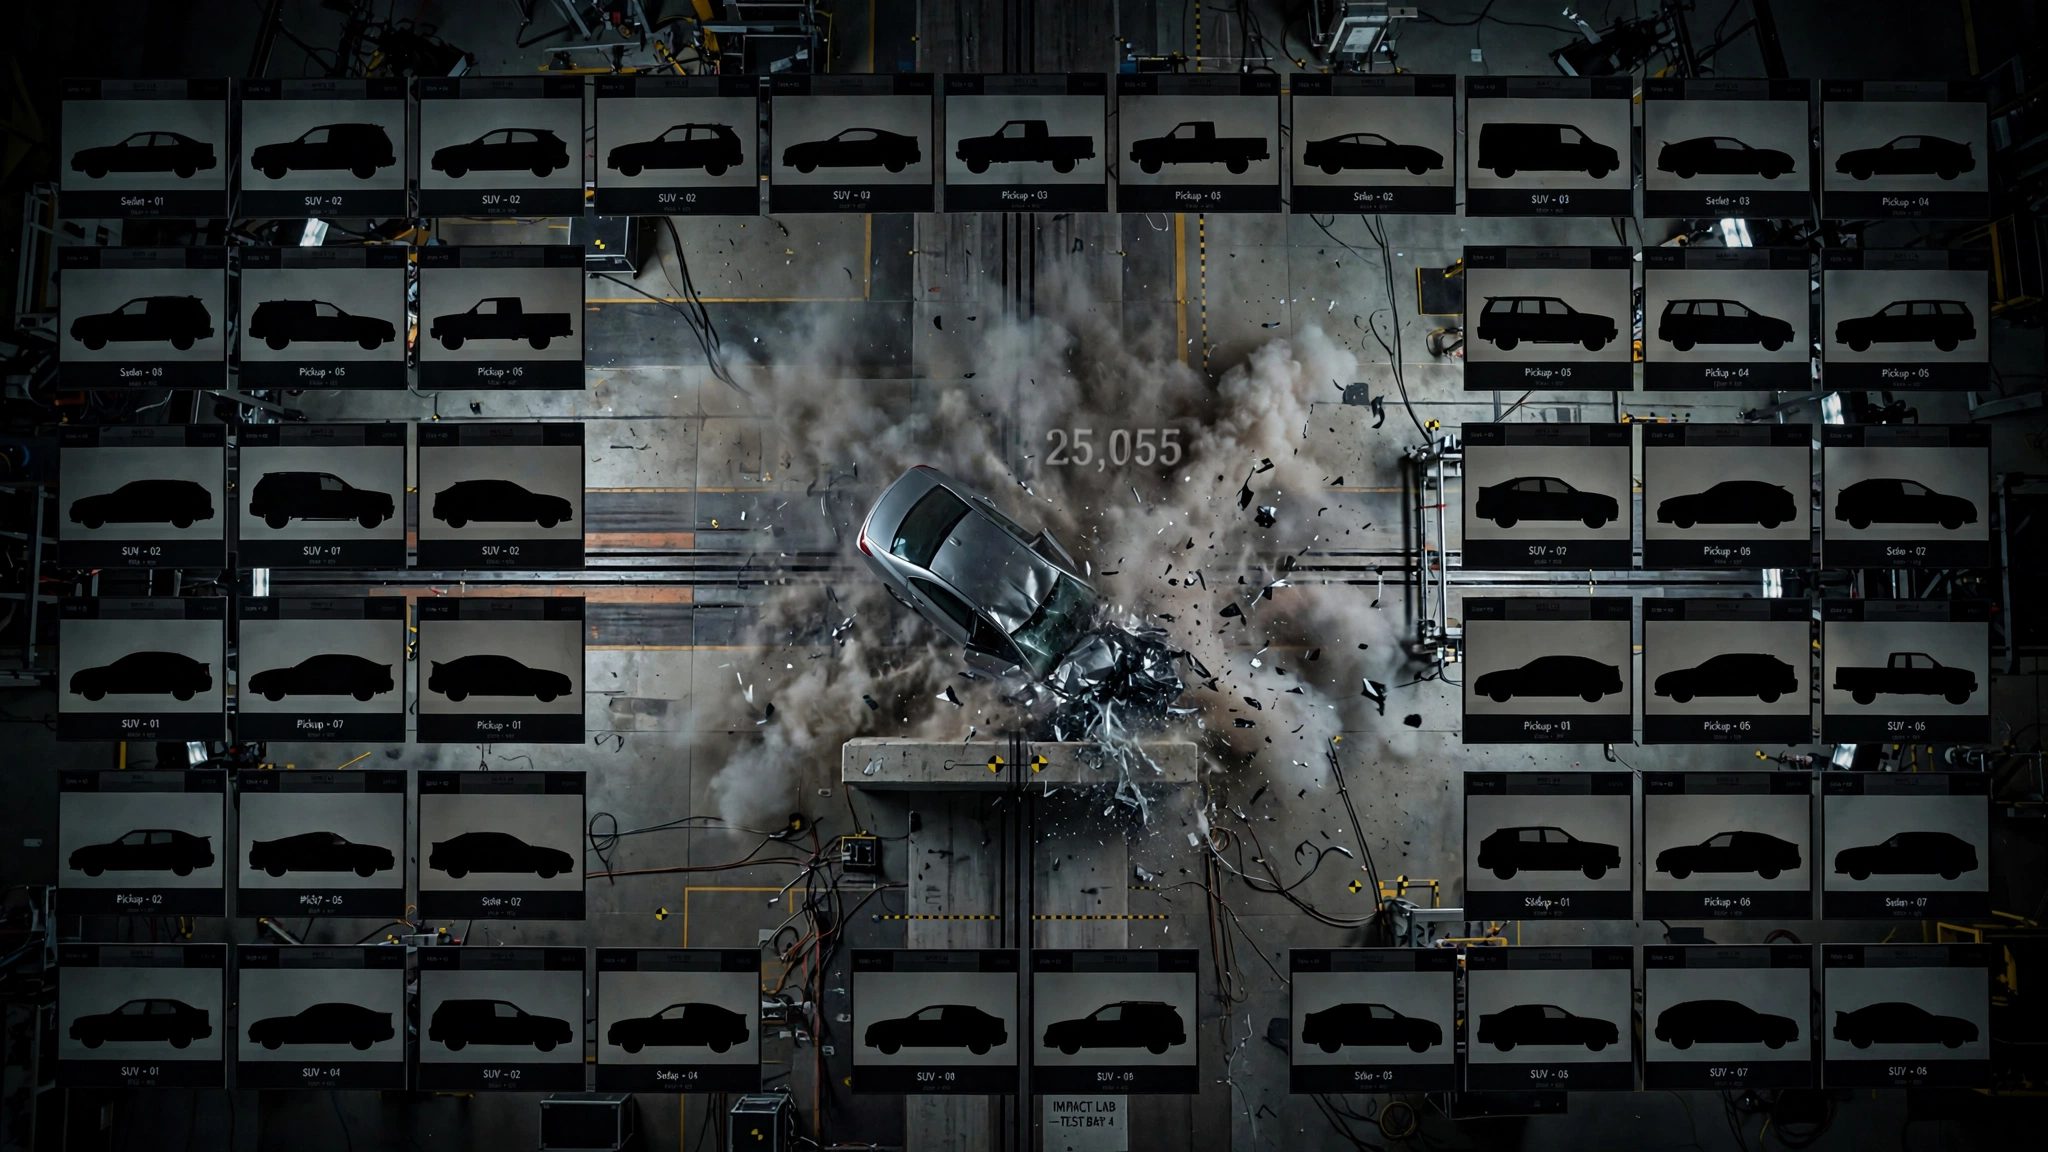
NHTSA published its 2026 crash test selection list last month: thirty-seven vehicles, from the Acura MDX to the Toyota RAV4 Hybrid, scheduled to be steered into barriers at controlled speeds, measured with calibrated dummies, and awarded between one and five stars for occupant protection.[1] Routine work. We cross-referenced the list with FARS, the federal database that records every traffic fatality in the United States, to check what these nameplates have already done on real roads where driver sobriety, fleet age, and speed are not standardized away.[2]
Twenty-four of the 37 test-list vehicles have enough crash history to match. Their combined body count over 2014–2023: 25,055 people killed. The Chevrolet Silverado alone accounts for 9,591 of those deaths, which is more than the next three vehicles (Corolla, Sentra, Grand Cherokee) put together. These aren't exotic nameplates; they're what America drives to the grocery store.
The total matters less than the spread. The Nissan Sentra's estimated fatality rate is 2.13 deaths per 100 million vehicle miles traveled; the Tesla Model Y sits at 0.03. Both vehicles will be slammed into the same barriers, at the same speed, with the same instrumented dummies strapped inside, and graded on an identical five-point scale. A five-star Sentra and a five-star Model Y will carry stickers that look interchangeable on the dealer lot, even though one nameplate appears in death certificates at seventy-one times the rate of the other. They don't mean the same thing.
Stars measure one thing well: how the vehicle's structure and restraints perform in a specific, repeatable laboratory impact, and that information is genuinely useful. What the star cannot capture is everything outside the lab that determines whether the car actually kills someone: the age of the vehicle when it crashes, the demographics and behavior of its driver population, the roads it frequents, and whether the person behind the wheel registered a blood-alcohol content of 0.12 before pulling out of the parking lot. The Sentra's 2.13 rate is not a design defect a crash test will catch; it is a composite signal about who buys Sentras, how old those Sentras are when they crash, and where those crashes happen. The RAV4, at 0.19, is eleven times safer by this measure, yet both could feasibly earn the same number of stars.
Strongest counterargument: NHTSA's test program has never claimed to predict real-world fatality rates, and arguing that it should is like criticizing a thermometer for not forecasting the weather. Lab standardization exists precisely to isolate structural crashworthiness from confounding behavioral and demographic variables, which is the entire point of the methodology.
That objection is fair, and it would be dispositive if consumers actually understood the distinction. They don't. Dealership window stickers don't carry an asterisk reading "this rating does not predict your probability of dying in this vehicle," and the five-star graphic communicates absolute safety assurance in a way the underlying methodology never intended. A buyer cross-shopping a Sentra and a Crosstrek (rate: 0.08, a 27-to-1 gap) deserves to know that the star counts, even if identical, describe radically different real-world outcomes.
Limitations: FARS captures fatal crashes only, which represent roughly 40,000 of the approximately 6.7 million annual U.S. crashes. Thirteen test-list vehicles, mostly EVs and newer models such as the Rivian R1S, Kia EV6, and Hyundai Ioniq 5, lack sufficient FARS history to match. Estimated VMT-based fatality rates carry ±15% uncertainty, particularly for low-volume nameplates, and the Silverado figure aggregates all Silverado variants, including heavy-duty trims that may have different risk profiles.
What to do: Before you let a window sticker close the deal, look up your target vehicle's actual fatality record at NHTSA's FARS query tool. Two SUVs can both wear five stars while one kills at six times the rate of the other. Stars tell you how a structure handles a controlled impact, but FARS tells you how often people actually die in it.
Sources & References
- NHTSA, 5-Star Safety Ratings: MY 2026 Vehicles Selected for Testing, published 2026. nhtsa.gov
- NHTSA, Fatality Analysis Reporting System (FARS), 2014–2023 data. nhtsa.gov
- NHTSA, FARS Query Tool. Used for per-vehicle fatality lookups. cdan.dot.gov