NHTSA Says Your Roads Are the Safest Since 2014. In 2014, They Were Safer.
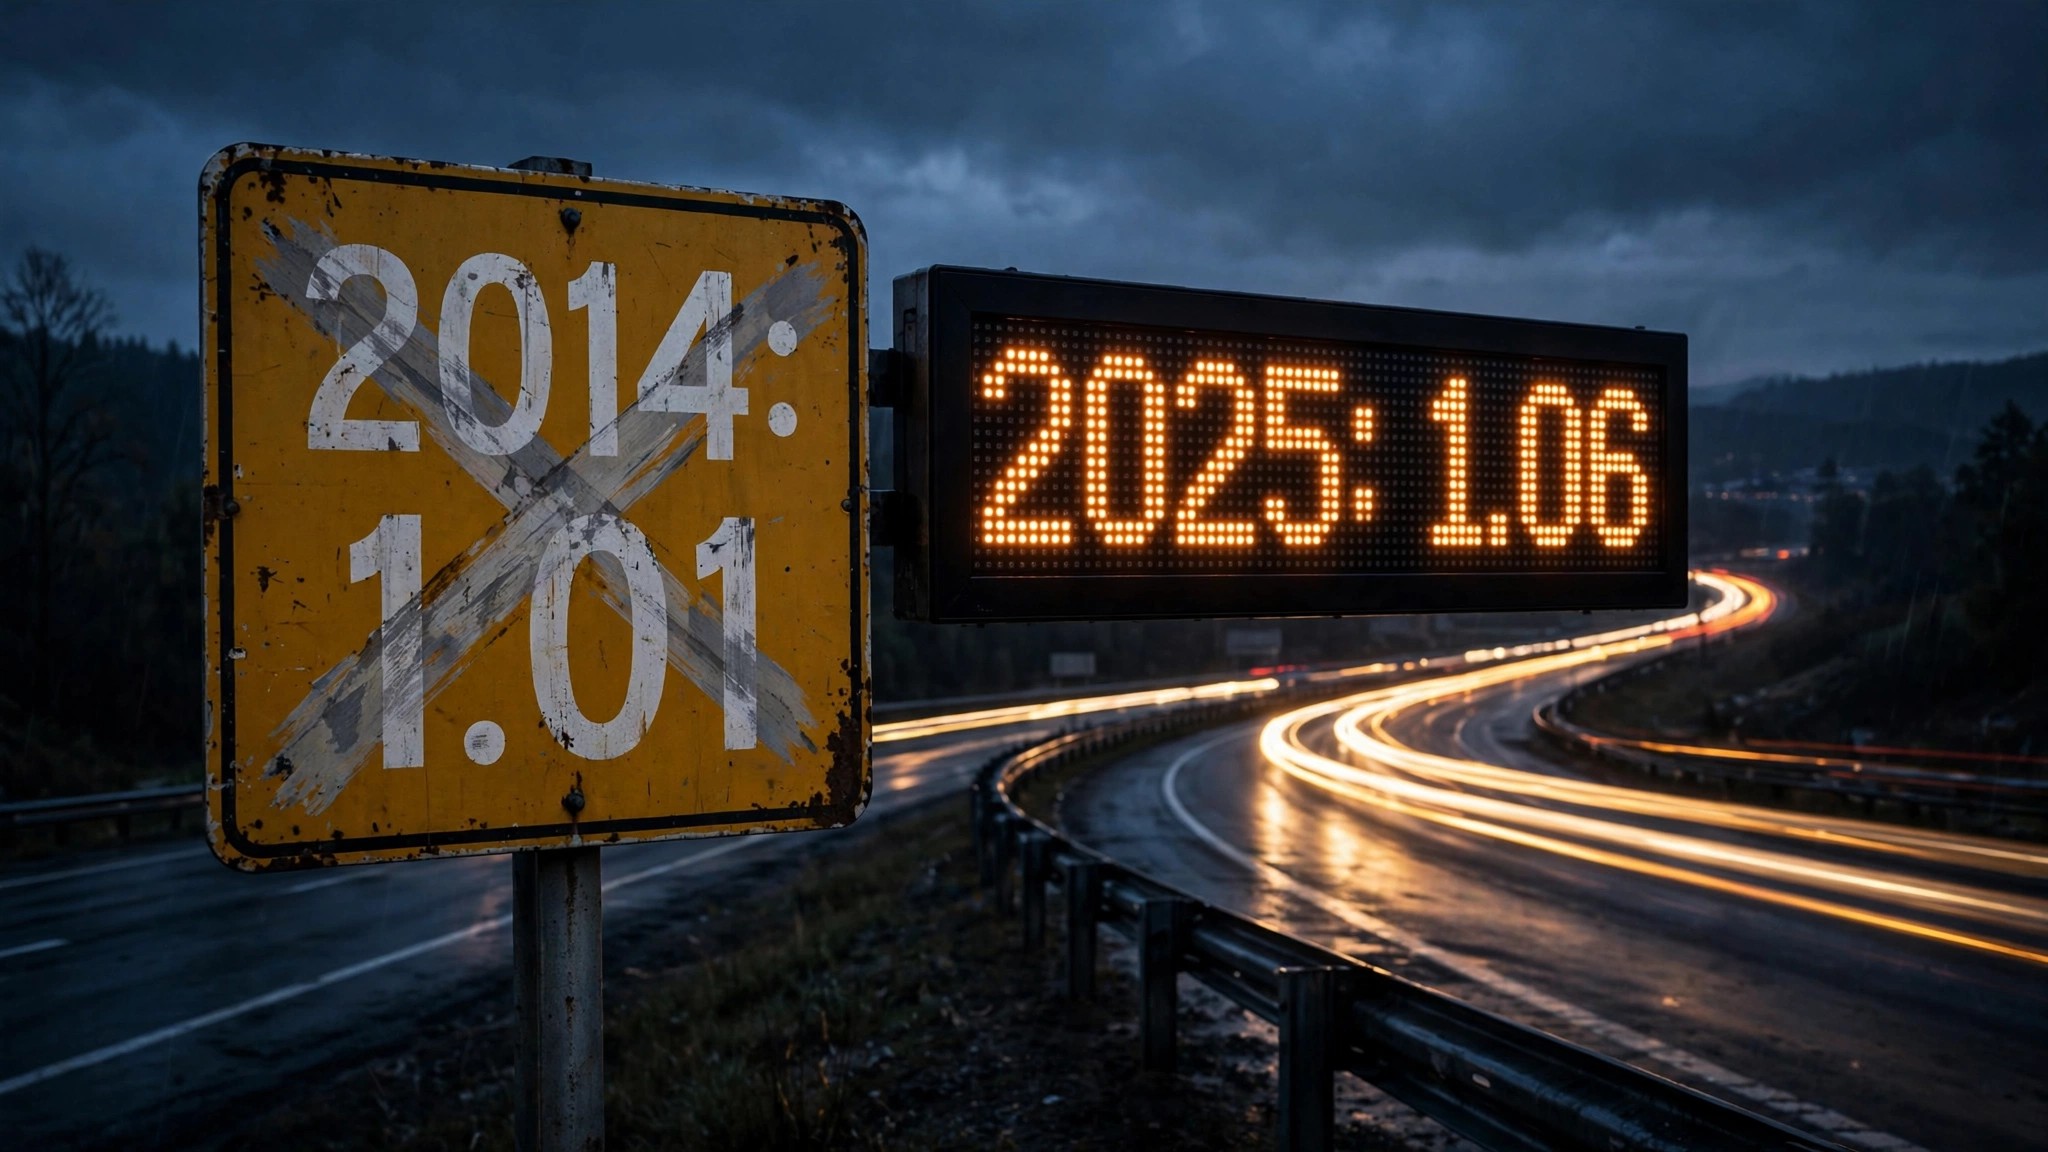
NHTSA dropped its first-half 2025 fatality estimates last month and the press release practically threw confetti. 17,140 people dead, an 8.2% decline, and a fatality rate of 1.06 per 100 million miles traveled — "the lowest mid-year fatality rate since 2014."[1] Thirteen consecutive quarters of decline. Every NHTSA region improved. Sounds like progress.
Except the actual H1 2014 rate was 1.01.[2] "Lowest since 2014" is doing a lot of work in that sentence. It means every year after 2014 was worse. And 2025, after a full decade of automatic emergency braking rollouts, IIHS pedestrian crash-prevention testing, lane-keeping systems, blind-spot monitors, and a federal stability control mandate that had been in force since 2012, is still 5% deadlier than the year none of that was standard on any production vehicle.
Read that again. In 2014, no car on a dealer lot came standard with AEB. Most didn't have lane-keeping. Pedestrian detection was a luxury option on a handful of European sedans. The fatality rate was 1.01. In 2025, after the industry spent the better part of $200 billion on driver assistance, the rate is 1.06. The technology didn't close the gap. It ran in place while the problem got harder.
And the body count tells it blunter. H1 2014: 15,035 dead. H1 2025: 17,140 dead. That's 2,105 more corpses at a rate the agency is calling historic progress.[2]
Buried in Table 3 of the CrashStats publication are the 11 states that got deadlier while the rest of the country improved. Hawaii's fatalities jumped 47.8% — from 46 to 68. Kansas spiked 21.2%. Idaho rose 18.6%. Massachusetts, a state not typically associated with dangerous roads, saw a 15.1% increase. The numbers are small enough individually that they vanish into the national aggregate, and large enough in percentage terms that actual families noticed.[2]
Then there's the disparity inside the "improvement" states. Mississippi dropped 25.7% and still has a fatality rate of 1.36. Connecticut dropped 32.5% to 0.71. If you live in Mississippi, your roads kill at nearly double Connecticut's rate even after Mississippi's best improvement in years. The decline isn't landing evenly. It's landing where infrastructure was already good.
The strongest case against this reading: The driving environment of 2025 is objectively harder than 2014's. Average vehicle curb weight climbed roughly 500 pounds as SUVs and EVs swallowed the sedan market. Pedestrian fatalities rose over 70% from their 2014 low as higher front-end profiles turned fender-benders into fatalities. Smartphone-driven distraction exploded. Without AEB, ESC, and the rest, the 2025 rate might sit at 1.4 or 1.5. The tech isn't failing. It's fighting a war the press release doesn't acknowledge.
Fair. And that's precisely what makes "lowest since 2014" such misleading framing. If the real story is "safety tech is barely keeping pace with a worsening environment," say that. Don't stage a victory lap at a number that's 5% behind the benchmark year you name-checked. NHTSA's own Table 1, in the same document, shows the 2014 rate in the row directly above. The gap is right there. The press release looked past it.[1]
What to do with this. If you're car shopping, don't assume a 2025 model is safer than a 2014 of the same type just because the national rate is trending down. Check your state's numbers. Hawaii, Kansas, Idaho, and Massachusetts are all moving the wrong direction. If you already own your car, check your VIN at nhtsa.gov/recalls — the recall completion rate nationally hovers around 70%, meaning three in ten recalled vehicles are still running around unrepaired.
Limitations: The H1 2025 figures are NHTSA statistical projections, not final FARS counts; they will be revised when the 2024 Final File and 2025 Annual Report File arrive over the next two years. State-level estimates use a proportional inflation model and can shift on final tallies. Small-state percentage swings (Hawaii went from 46 to 68; Wyoming from 49 to 54) are volatile by nature. The 2014 comparison also doesn't account for changes in road type mix, urban/rural driving ratios, or fleet age composition. FARS captures only fatal crashes; a vehicle or state with a low fatality rate might still have high injury rates.
Sources & References
- NHTSA, “NHTSA Reports Sharp Drop in Traffic Fatalities in First Half of 2025,” press release, September 2025. nhtsa.gov
- National Center for Statistics and Analysis, “Early Estimate of Motor Vehicle Traffic Fatalities for the First Half (January–June) of 2025,” Crash•Stats Brief Statistical Summary, Report No. DOT HS 813 756, September 2025. crashstats.nhtsa.dot.gov
- NHTSA, Fatality Analysis Reporting System (FARS), 2013–2023 Final Files. nhtsa.gov
- Federal Highway Administration, Traffic Volume Trends, June 2025. fhwa.dot.gov
Source: NHTSA CrashStats DOT HS 813 756 and FARS 2013–2023. H1 2025 figures are statistical projections, not final counts; State-level estimates are derived from proportional allocation within NHTSA regions. See methodology for caveats.