Every Vehicle Has a Single Worst Year. For 23 of Them, It’s 2004.
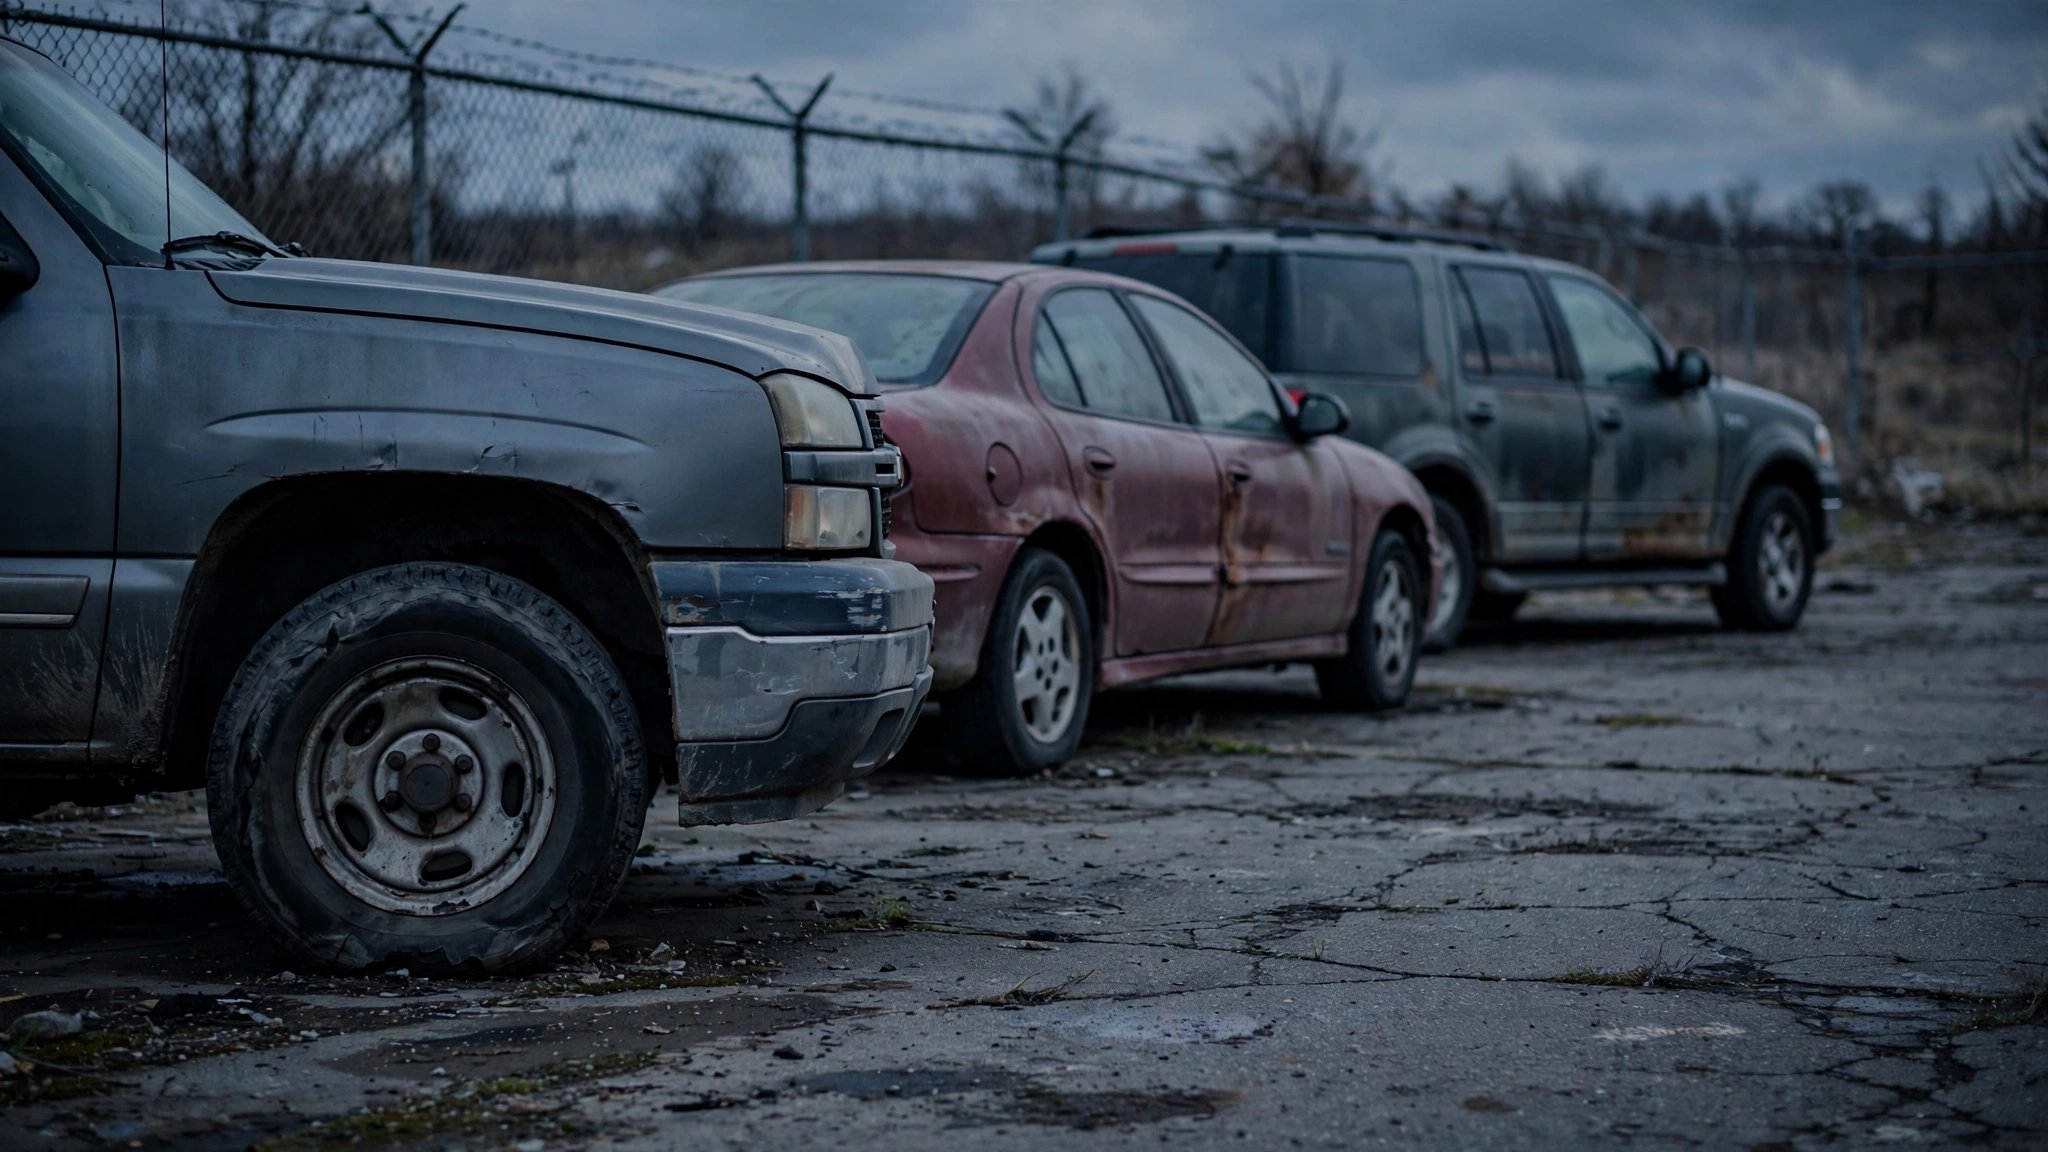
Run every vehicle in the FARS database through a filter and find the single model year that racked up the most fatal crashes between 2014 and 2023, and one number keeps surfacing. Model Year 2004 is the peak death vintage for 23 separate vehicles, producing 3,158 fatalities. Runner-up 2005 claims 15, but Model Year 2004 doesn’t just lead the field; it laps it.
Chevrolet Silverado at 663 deaths, Dodge Ram at 369, Cavalier at 210, Ford Expedition at 198. Not exotics that crashed spectacularly but trucks and sedans that sold by the millions during the pre-recession boom, then spent two decades quietly killing their second and third owners while everyone congratulated themselves on falling national fatality rates.
Three forces converge on this one model year. First, Electronic Stability Control — responsible for an estimated 49% reduction in fatal single-vehicle crashes for cars and 73% for SUVs according to IIHS research — was almost entirely absent from the 2004 fleet.[1] NHTSA wouldn’t finalize the ESC mandate until 2007, with full compliance required by 2012, and every 2004 Cavalier, Envoy, and Expedition rolled off the line without it.[2]
Second, 2004 was the last gasp of dying platforms: Cavalier became Cobalt in 2005, Grand Am became G6, Venture became Uplander. End-of-run vehicles get minimum investment — no mid-cycle safety upgrades, no structural reinforcements, no crash-test improvements for a nameplate about to be killed. GM didn’t need the 2004 Cavalier to be safe; it needed it to sell until the Cobalt tooling was ready, and two hundred ten of its drivers wound up in the FARS database.
Third, the FARS window runs 2014 through 2023, placing MY 2004 vehicles at 10 to 19 years old during the measurement period, squarely in the second-owner death zone where vehicles pass from maintained first buyers to used-car buyers who can’t afford brake pads, tire replacements, or recall repairs. A 663-death Silverado wasn’t killing its original owner with a warranty and fresh tires; it was killing whoever inherited it a decade later at 180,000 miles.
Fleet size is the obvious counterargument, and it deserves weight: model years 2003 through 2005 were peak production, and more vehicles mechanically produce more crashes. Without registration data we cannot calculate death rates, only counts. But volume alone cannot explain a 23-vehicle pileup at one vintage when surrounding years claim 14 or fewer, across sedans, pickups, SUVs, and vans simultaneously.
If you’re shopping for a vehicle older than 20 years, MY 2004 is the single worst vintage across the broadest range of makes in the FARS dataset. Check your VIN at nhtsa.gov/recalls, and if the first four digits of your title say 2004, the data says you’re driving a statistical peak.
Sources & References
- IIHS, “Life-saving benefits of ESC continue to accrue,” 2011. iihs.org
- NHTSA, Electronic Stability Control Final Rule, FMVSS 126, June 2007. govinfo.gov
- NHTSA, Fatality Analysis Reporting System (FARS), 2014–2023. nhtsa.gov