For One Month, America's Roads Were Safer Than Before COVID. Don't Get Used to It.
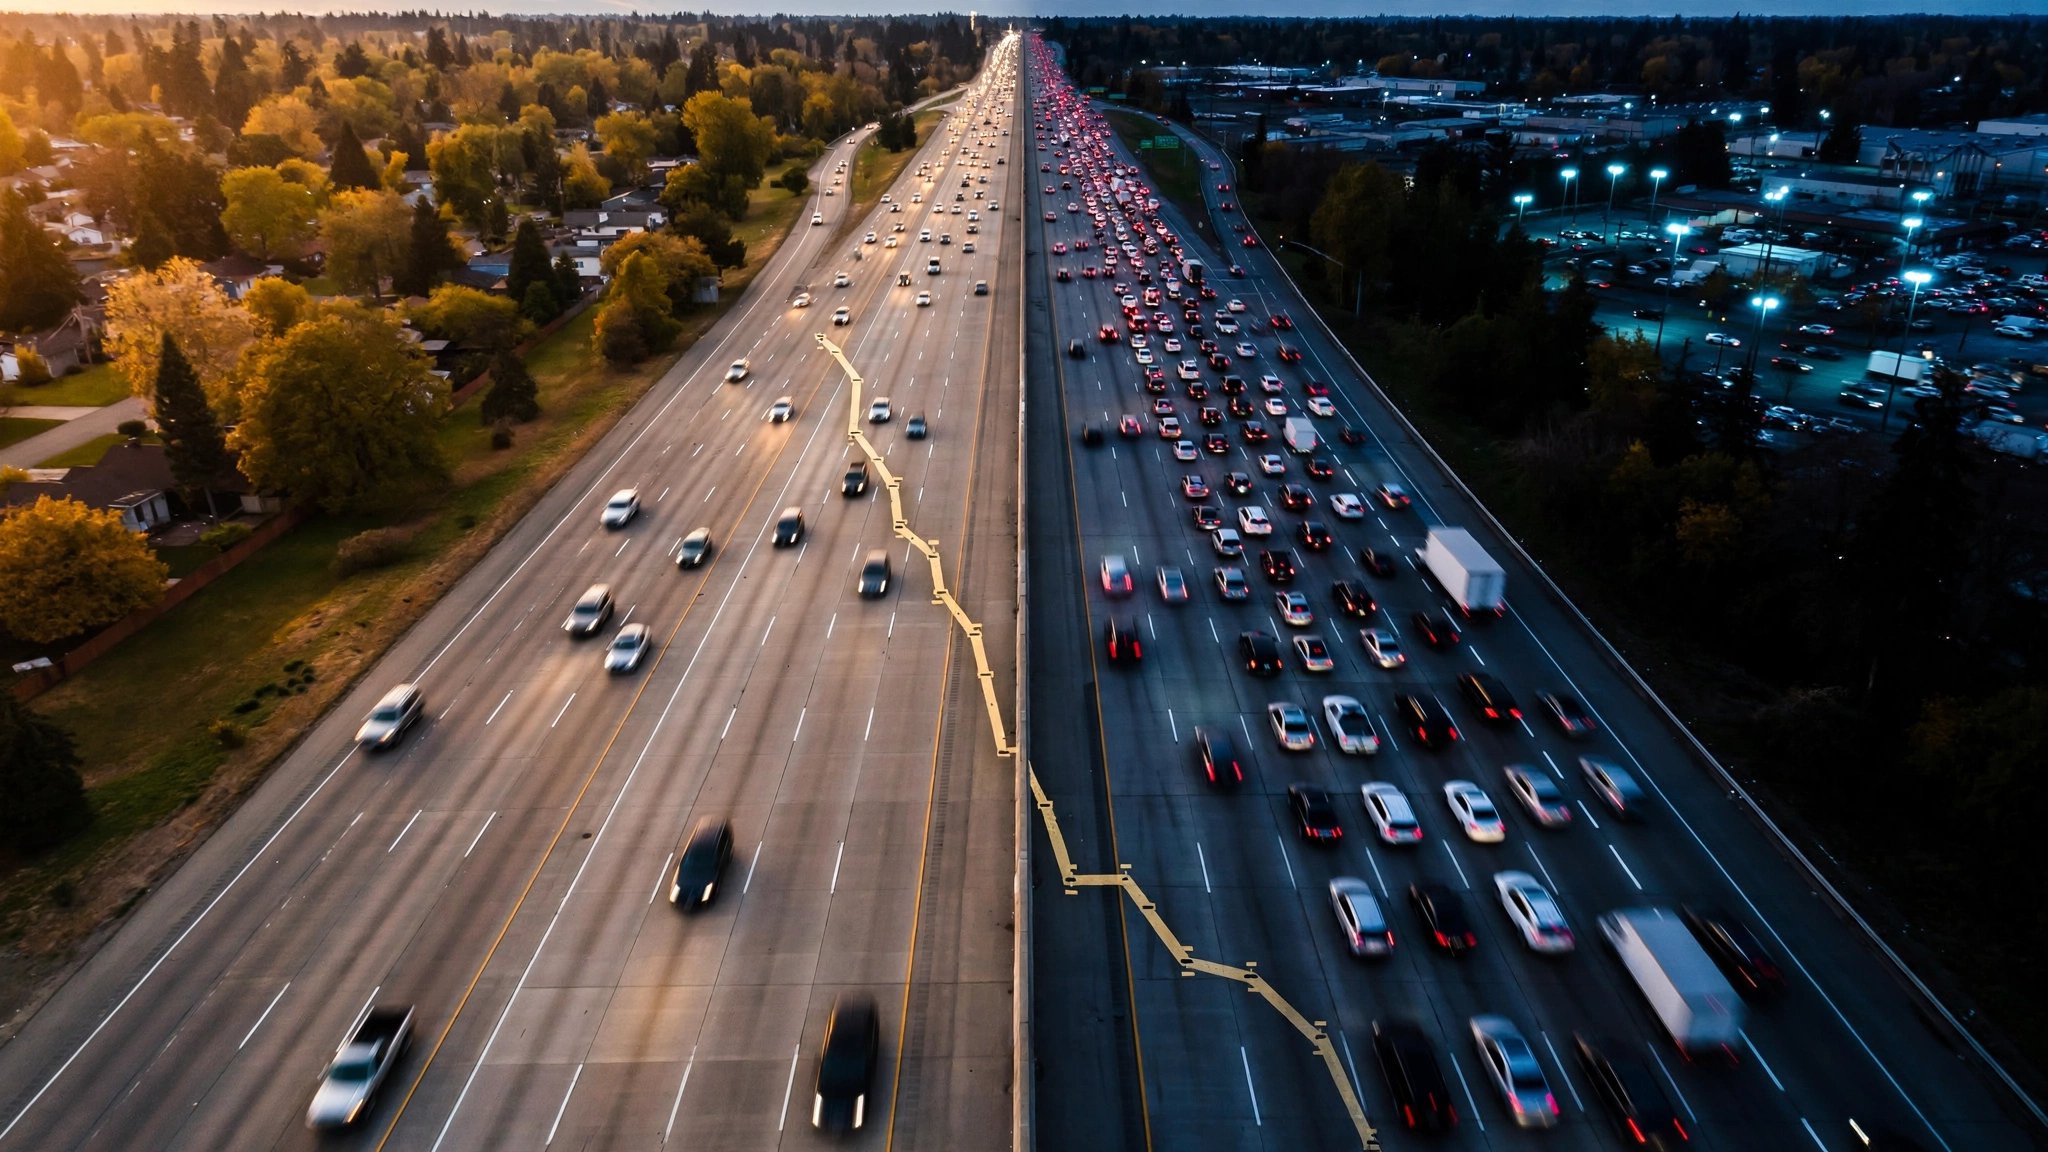
March 2026 killed 3,030 people on American roads, producing a mileage death rate of 1.07 per 100 million vehicle miles traveled.[1] That sits below 1.13, the average annual rate from 2014 through 2019. For the first time since a respiratory virus rewired America's relationship with speed and sobriety, a single month's fatality rate fell beneath the floor that existed before everything went sideways.
One month. Celebrate accordingly.
March is a low-season month: shorter recreational driving, fewer motorcycles, no holiday-weekend corridor massacres. Comparing year over year partially controls for seasonality, and the three-year glide path is real: 1.21 in March 2023, 1.20 in 2024, 1.07 now.[1] Deaths down 6%, miles driven up 1.6%, the mileage death rate down 7%. Annualize March's 1.07 rate across 3.36 trillion estimated VMT and you get roughly 35,950 deaths, a number that would be genuinely historic and that nobody who studies traffic fatalities for a living actually expects to hold through the summer months when motorcycle registrations spike, recreational road trips stretch across every two-lane highway between the coasts, and the combination of daylight, alcohol, and speed produces fatality rates 15 to 25 percent higher than the spring baseline. A realistic full-year estimate lands between 37,000 and 39,000 deaths.
Still progress, but not what the headline is selling you.
Eleven states got 20% safer while seven got 20% worse
Pull the national average apart and a geographic fracture emerges that barely qualifies as the same country. New York's Q1 2026 fatalities dropped 72 percent: eighty-nine fewer deaths.[1] Alabama fell 43 percent (100 fewer), Washington 26 percent, Wisconsin 32 percent. Meanwhile Mississippi climbed 33 percent with thirty-six additional deaths in a single quarter, Iowa rose 27 percent, and D.C. posted a 300 percent increase that sounds apocalyptic until you learn the base was three deaths jumping to twelve.
Coastal states with newer vehicle fleets improved dramatically, while rural states running older iron moved in the opposite direction, and fleet composition rather than enforcement campaigns or new legislation appears to be doing the heavy lifting at the state level.
Twenty-one thousand bodies
Between 2020 and 2024, the elevated post-COVID fatality rate generated roughly 21,500 excess traffic deaths compared to what the pre-pandemic baseline would have predicted.[2][3] Peak carnage arrived in 2021: a rate of 1.33 on 3.21 trillion miles yielding an estimated 6,400 excess deaths in a single calendar year. By 2024 the annual excess had shrunk to about 2,000. March 2026 at 1.07 suggests the COVID debt may finally be paid in full.
That number carries a policy signal, not closure. Higher speeds, more aggressive driving, lower seatbelt use in certain demographics, and a documented increase in impaired driving all contributed to a behavioral shift that outlasted the lockdowns by years. Something about the way Americans drove after the pandemic killed an additional twenty-one thousand people over half a decade, and returning to baseline means precisely that we are back to killing the normal amount. Back to normal. Chilling phrase.
What to do with this
If you are shopping for a vehicle in 2026, model year matters more than brand loyalty, color preference, or whatever the dealer is pushing. A 2019 Honda CR-V and a 2005 Honda CR-V share a nameplate and almost nothing else in crash protection. Check your VIN at nhtsa.gov/recalls. IIHS estimates electronic stability control alone prevents roughly one-third of fatal crashes, and if your vehicle predates the 2012 ESC mandate, replacing it remains the single highest-impact safety upgrade available at any price point.[4] No monthly statistic changes that math.
Strongest counterargument
Seasonal effects dominate monthly data so thoroughly that comparing any single March to an annual baseline risks being misleading. Year-over-year March comparisons partially control for this, but inter-annual noise from weather, gas prices, and holiday timing can swing monthly totals by 10 percent or more. Additionally, improved trauma medicine may be converting fatalities into severe injuries, meaning the roads are not actually safer so much as emergency departments have gotten better at keeping shattered people alive. If the injury-to-death ratio is shifting, the fatality rate flatters reality.
Limitations
NSC monthly estimates are preliminary and subject to 5 to 10 percent revision. VMT figures from FHWA are estimated, not measured. Our COVID-debt calculation applies uniform pre-COVID rates to post-pandemic VMT, which assumes driving behavior would have remained constant absent the pandemic; it would not have, as fleet turnover and technology adoption were already improving outcomes. State-level quarterly data involves small enough absolute numbers in low-population states that percentage changes become statistically meaningless, a problem that applies to roughly a dozen states beyond the three we flagged explicitly.
Sources & References
- National Safety Council, Motor Vehicle Deaths — Preliminary Monthly Estimates, March 2026. injuryfacts.nsc.org
- NHTSA, Fatality Analysis Reporting System (FARS), 2014–2023. Historical rate computations from FARS annual reports. nhtsa.gov
- NHTSA, “2025 Traffic Death Estimates & 2024 FARS Final,” April 2026. nhtsa.gov
- IIHS, “Life-saving benefits of ESC continue to accrue,” 2011. iihs.org
- FHWA, Traffic Volume Trends. fhwa.dot.gov
Source: NSC preliminary estimates (March 2026), NHTSA FARS 2014–2023. Monthly data is preliminary and subject to revision. COVID-debt calculation uses estimated VMT × pre-COVID rate differentials. See methodology for caveats.