438 People Will Die This Weekend. Here’s When, Where, and in What.
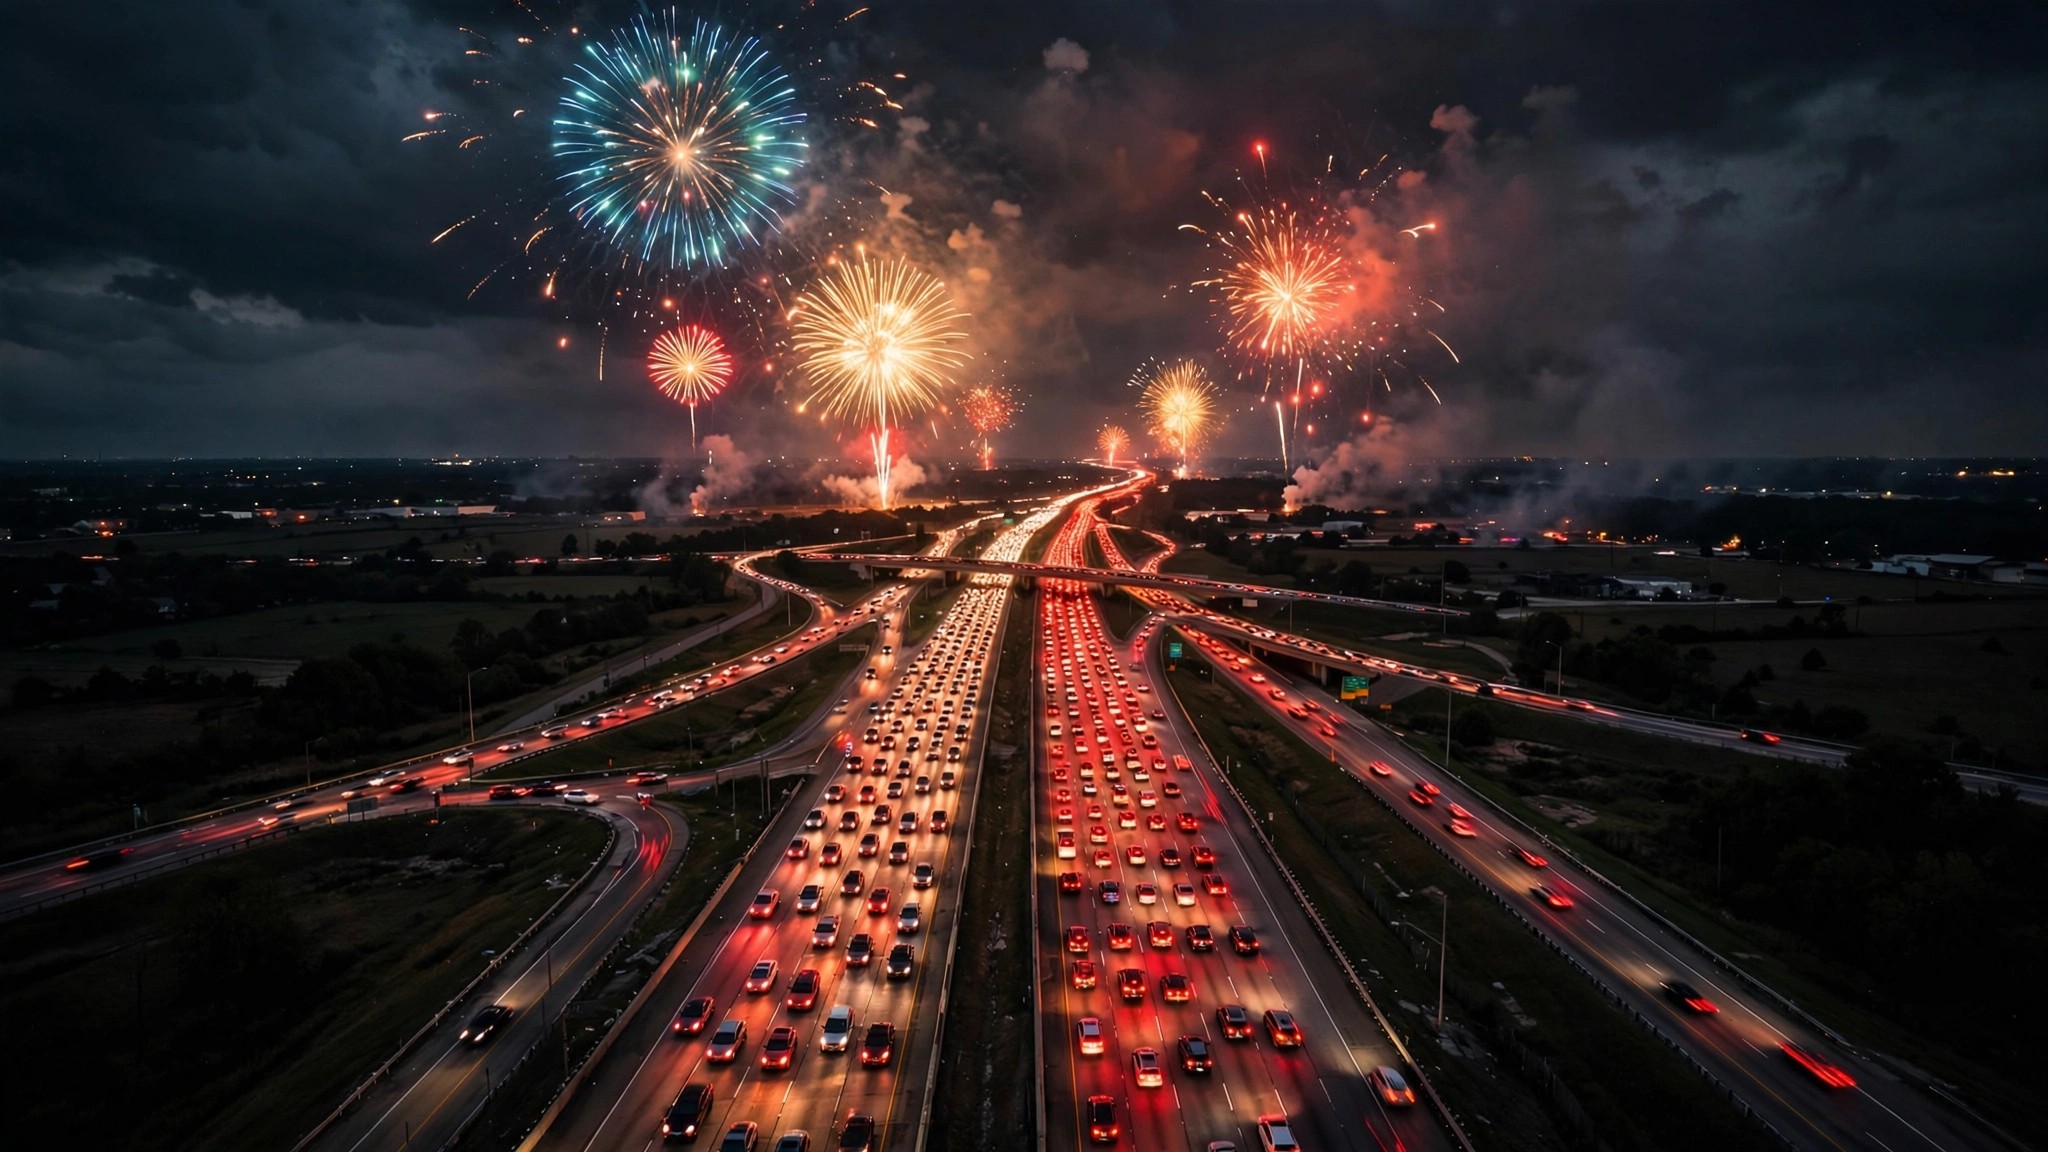
According to the toxicology reports, the National Safety Council’s forecasting model, and ten years of FARS crash data I cross-referenced over the weekend because I am fun at parties: approximately 438 people will die in traffic crashes between 6 PM Thursday, July 3rd, and midnight Sunday, July 6th. That is 5.6 deaths per hour, every hour, for 78 consecutive hours.
The annual alcohol-involvement rate in fatal crashes is 15.1%, per FARS 2014–2023 data spanning 490,736 tested drivers.[1] On Independence Day weekend, that number jumps to 38%.[2] That is not a gradual seasonal uptick but a behavioral cliff concentrated into a single weekend. Nothing else on the calendar does this, not Thanksgiving, not Christmas, and not even New Year’s Eve, which at least has the decency to be a single night with organized rideshare infrastructure and transit contingencies.
July 4th is decentralized in a way no other major holiday manages: backyards, parks, beaches, driveways, rooftops, all of them scattered across suburbia with zero transit planning. Nobody builds a rideshare corridor around a cul-de-sac fireworks party, and fireworks end between 9:30 and 10:30 PM in most cities, which means that by 11 PM the roads are full of drivers who started drinking at noon.
Which cars to watch for
I ran our FARS toxicology dataset to identify vehicles with the highest impairment rates in fatal crashes, because the logical question when somebody tells you 38% of the highway is drunk is: in what?
Chevrolet’s Corvette leads at 26.2% any-impairment involvement across 1,147 fatal-crash drivers tested between 2014 and 2023.[1] One in four Corvette drivers killed or killing on American roads had alcohol or drugs in their system. Behind it, the Camaro sits at 23.0% across 2,832 drivers, the Challenger at 22.5% across 2,037, and the Mustang at 21.9% across 4,664 tested drivers in the same decade. Sports cars as a class average 22.5% impairment, compared to 18.1% for vans, and that 4.4-percentage-point gap becomes a canyon when you apply the July 4th alcohol multiplier. If the holiday’s 2.5x impairment ratio distributes proportionally across vehicle classes, weekend Corvette impairment approaches 53%.
Nobody is publishing that number, which is exactly the kind of silence that invites somebody to fix it.
The vehicles you want to be near
Minivans and family SUVs consistently carry the lowest impairment rates in fatal crash data. Subaru’s Ascent registers just 8.2% any-impairment across 305 tested drivers, the Honda Odyssey comes in at 15.4% across 2,641 drivers, and the Dodge Grand Caravan at 15.3% across 2,627.[1] Even the Toyota Prius, that smug little hatchback, sits at a relatively tame 16.0%. These are vehicles driven by people who have somewhere to be on Monday morning and small passengers in the back seat who do not appreciate pyrotechnic hangovers.
Van class alcohol involvement averages 13.4% annually, and applying the July 4th multiplier gets you roughly 33%, which is still terrifying but substantially less terrifying than the sports-car corridor pushing past 50%.
The killing window
NSC’s methodology uses exponential smoothing with seasonality on NHTSA FARS monthly data, projecting total July 2025 traffic deaths at 3,801, then extracting the holiday fraction, which has averaged 11.5% over the prior six holiday periods.[3] Their 90% confidence interval runs from 377 to 501 deaths, and the midpoint is 437. I rounded to 438 because that is what their methodology gives you when you extrapolate to 2026 with annual fatalities holding roughly flat, which they have since 2021, oscillating between 38,800 and 42,900 without a clear directional break.[4]
The compressed departure hypothesis is straightforward: fireworks are synchronous, and sixty-one million people travel by car for July 4th.[5] Most of them arrive throughout the day, but most of them leave within a two-to-three-hour window after the show ends. That creates a mass drunk-driving event between 10 PM and 1 AM on July 4th and 5th that dwarfs anything New Year’s Eve produces, because New Year’s Eve has DUI checkpoints, Uber surge pricing, and public awareness campaigns. July 4th has a half-eaten watermelon and a cousin who swears he only had three beers.
What to do
Stay off the road between 10 PM on Friday, July 4th, and 3 AM Saturday, July 5th, because that is the peak of the peak. If you must drive, check your vehicle identification number at nhtsa.gov/recalls before the trip. There are active safety recalls right now affecting vehicles with potential brake, airbag, or steering failures, covering millions of units, and the recall completion rate in America hovers around 70%. Unfixed recalls are always a background risk, but on a weekend where 38% of surrounding drivers are impaired, you need every safety system working.
Buckle your seat belt, because this should not require repeating in 2026, but unbuckled occupants remain 9% of the driving population and roughly half of vehicle-occupant fatalities.[1] A $40 click halves your probability of being one of the 438.
Limitations
I should note what this analysis does not prove. That 438 figure is a statistical projection, not a census of the future. Raw death counts partly reflect more miles driven, not just more impairment, since 61.6 million holiday drivers represent meaningfully more exposure. FARS toxicology data is an annual aggregate (2014–2023), not July-specific, so the per-vehicle impairment-multiplier calculation assumes the holiday spike hits all vehicle classes equally, which is reasonable but unproven. Not all states test all fatal-crash drivers for all substances, introducing systematic undercount in the drug impairment column.
And the strongest counterargument against alarm: the per-mile fatality rate on July 4th weekend may not spike as dramatically as the total-death count because total VMT also surges. That 38% alcohol rate is not a VMT artifact, though, because that is a behavior measurement, not an exposure measurement. There are genuinely more drunk people behind wheels per unit of road on July 4th than on any other weekend of the year.
Four hundred thirty-eight people across three and a quarter days, every one of them preventable. Drive like somebody’s counting.
Sources & References
- NHTSA, Fatality Analysis Reporting System (FARS), 2014–2023. nhtsa.gov
- NHTSA, Drunk Driving: July 4th Holiday. nhtsa.gov
- National Safety Council, Independence Day 2025 Motor Vehicle Fatality Estimates. injuryfacts.nsc.org
- NHTSA, Traffic Safety Facts Annual Report. crashstats.nhtsa.dot.gov
- AAA, Independence Day 2025 Travel Forecast. newsroom.aaa.com