The Toyota Highlander Has the Best Death Rate in Its Class. It Just Failed the Only Test That Checks on Your Kids.
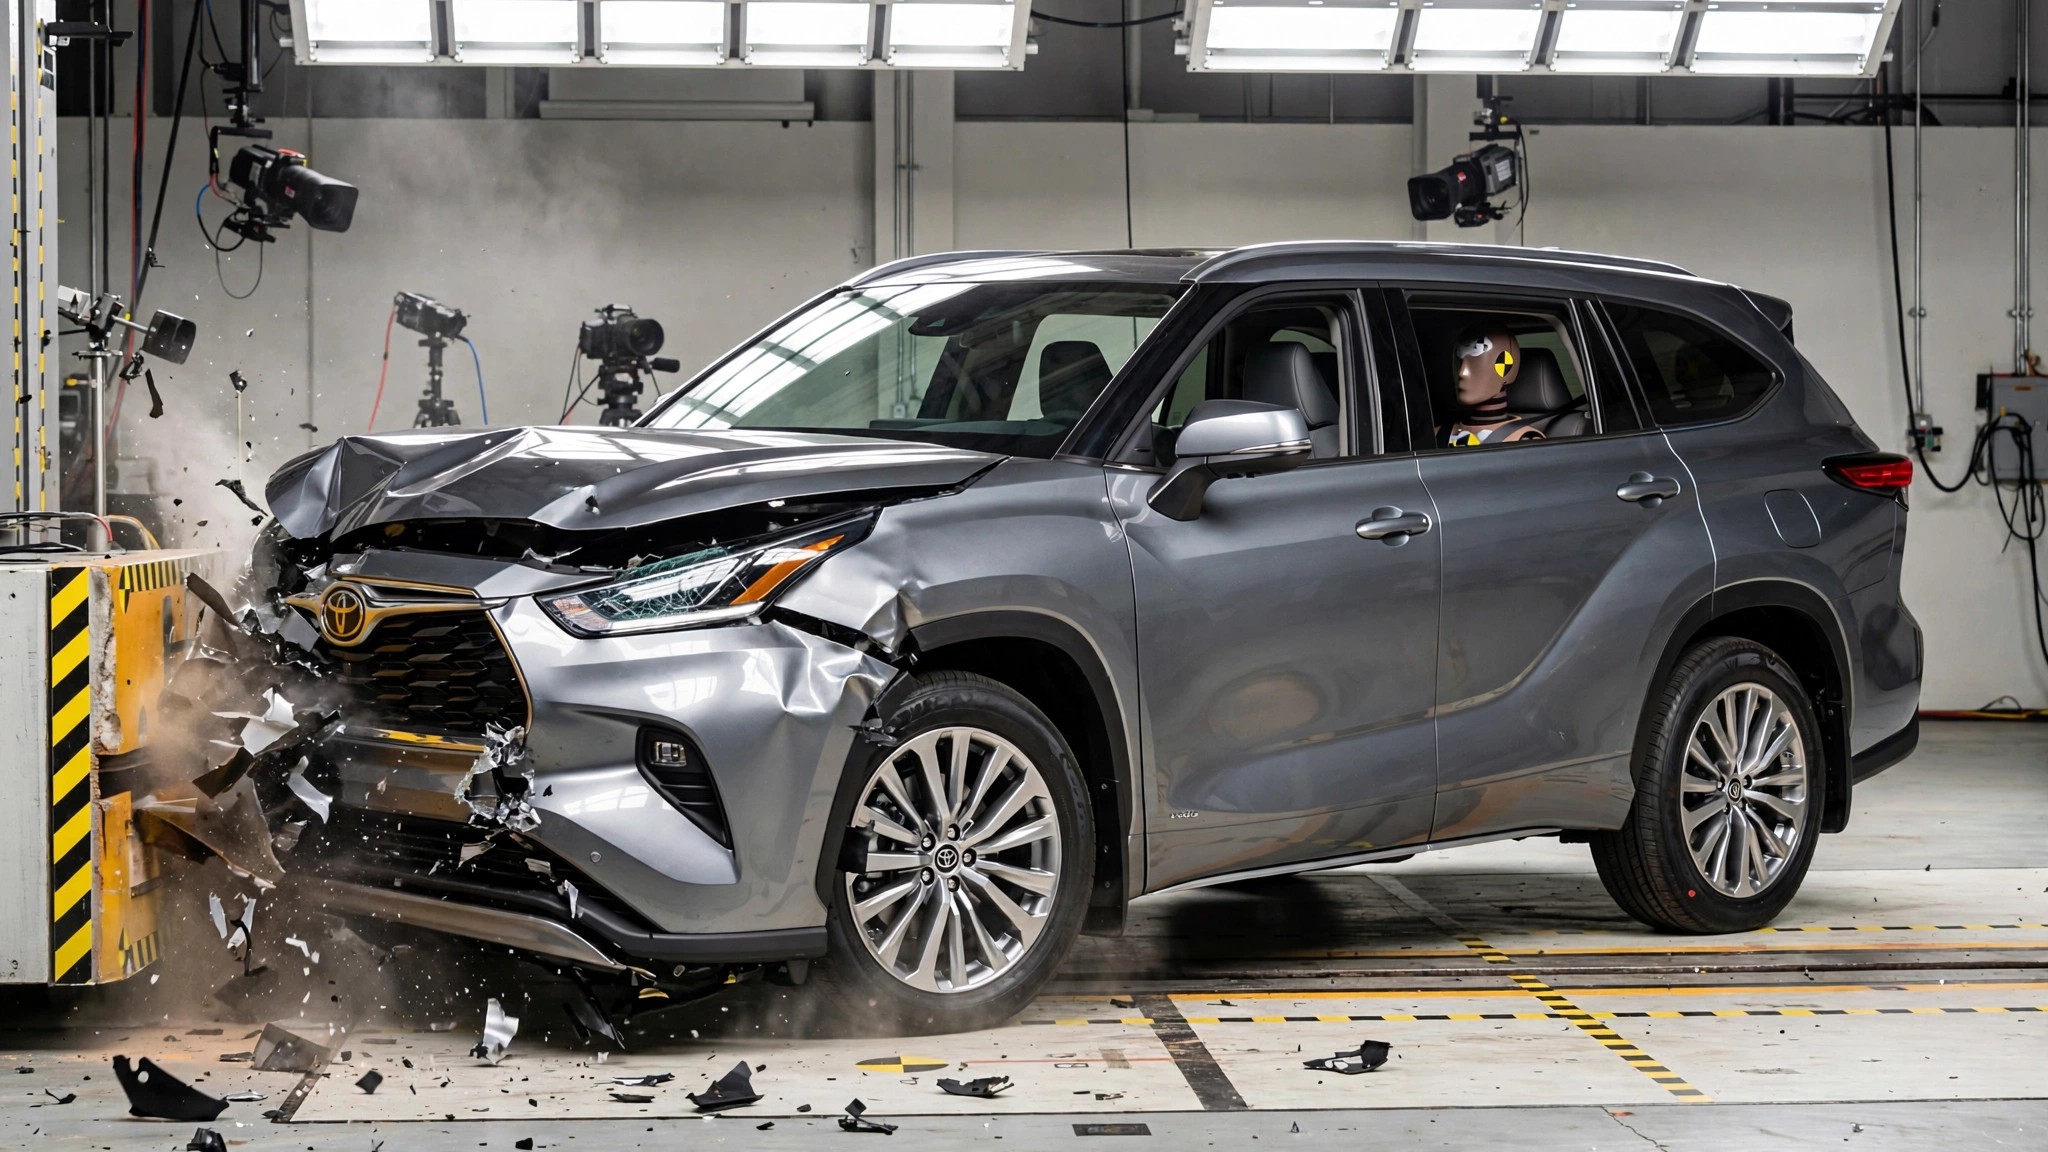
I ran the numbers on every three-row SUV in the FARS database. Ranked by fatality rate per 100 million vehicle-miles traveled, the Toyota Highlander sits at 0.42 deaths per 100M VMT on a fleet of 2.1 million vehicles. Only the Honda Pilot (0.29 on 1.4M) and the Chevrolet Traverse (0.20 on 1.1M) beat it among models with more than half a million registrations. It's a third of the Ford Explorer's 1.54. A sixth of the Tahoe's 2.49. By the only metric that counts dead people and controls for mileage, the Highlander is one of the safest three-row SUVs you can buy.[1]
Then IIHS put a crash-test dummy the size of a twelve-year-old in the seat behind the driver and ran the updated moderate overlap test. Front-occupant protection was fine. Readings from the rear dummy showed elevated risk of head, neck, and abdominal injuries. Rating: marginal. No Top Safety Pick. No award at all.[2]
The Subaru Ascent, meanwhile, earned TSP+ with good ratings across the board, including the same rear-seat test. Its FARS fatality rate? 0.78 per 100M VMT, nearly double the Highlander's, on a fleet one-fifth the size.[1] [2]
Two data sources. Opposite verdicts. Both correct. FARS aggregates every fatal crash across all occupant positions, all model years, all road types for a decade. IIHS's moderate overlap test isolates one scenario: a 40-percent-offset frontal impact at 40 mph, with instruments strapped to a dummy sitting where your kid sits. One dataset says "this vehicle rarely kills people." Another says "when it does, the person in row two is in more trouble than the person in row one."
That distinction matters because the entire reason someone buys a three-row SUV is to put people in the back rows. Usually children. Toyota sold over 264,000 Highlanders in 2024. Nobody bought one for the driving dynamics. They bought it because it has seven seats and a reputation for reliability. And the rear-seat test is the one that measures whether the product does what the customer bought it for.
NHTSA's five-star rating program does not test rear-seat occupant protection in offset frontal crashes. Five stars on the Highlander's window sticker. IIHS added the rear-seat dummy to its moderate overlap test precisely because the five-star system doesn't cover it.[3] Without that update, no standardized test in the United States would have caught this.
For context, the full three-row SUV class from FARS, sorted by fatality rate:
| Vehicle | Deaths | Fleet | Rate |
|---|---|---|---|
| Kia Telluride | 31 | 612K | 0.04 |
| Hyundai Palisade | 38 | 481K | 0.06 |
| VW Atlas | 26 | 306K | 0.06 |
| Chevrolet Traverse | 265 | 1.1M | 0.20 |
| Honda Pilot | 514 | 1.4M | 0.29 |
| Toyota Highlander | 1,106 | 2.1M | 0.42 |
| Dodge Durango | 356 | 525K | 0.54 |
| Subaru Ascent | 426 | 438K | 0.78 |
| Nissan Pathfinder | 712 | 612K | 0.93 |
| Ford Explorer | 3,797 | 2.0M | 1.54 |
| Chevrolet Tahoe | 2,592 | 831K | 2.49 |
By FARS numbers, the Highlander sits comfortably in the safe half. And yet: the one test that specifically checks on row two gave it a marginal. A crash-test dummy representing your kid showed elevated head and neck injury risk. Toyota has not announced engineering changes.
What this means if you're shopping
Check the IIHS moderate overlap test result, not just the star rating. NHTSA's five-star program does not cover rear-seat frontal protection. If you have children who ride in the second row, IIHS's updated moderate overlap test is the closest thing to a direct measurement of their safety. For 2026, the Subaru Ascent, Honda Pilot, and Hyundai Palisade (built after November 2025) all earn good marks. Toyota's three-row entry does not.
Limitations
FARS does not break down fatalities by seating position at the model level. We cannot independently verify whether rear-seat Highlander occupants die at rates different from front-seat occupants. That 0.42 rate is an aggregate across all positions, all crash types, all model years 1996 through 2022. IIHS evaluates one specific crash mode at one specific speed. A vehicle can fail a lab test and still have excellent real-world outcomes overall. These two data sources measure different things.
There is also a statistical tension: the Ascent's FARS rate (0.78) is nearly double the Highlander's (0.42), but the Ascent passes the rear-seat test. Small-fleet vehicles carry wider confidence intervals, and the Ascent's 438,000 registered units are a fifth of the Highlander's 2.1 million. That higher Ascent rate may also reflect its younger fleet (introduced 2018) encountering more crash exposure per vehicle-year in the FARS window. Neither dataset tells the whole story alone.
Sources & References
- NHTSA, Fatality Analysis Reporting System (FARS), 2014–2023. nhtsa.gov
- IIHS, 2026 crash test ratings and Top Safety Pick criteria. iihs.org
- Consumer Reports, “Safest New Cars of 2026, According to the IIHS.” consumerreports.org