Half of All Recalled Vehicles Never Get Fixed. The Average Car Is Too Old for Anyone to Care.
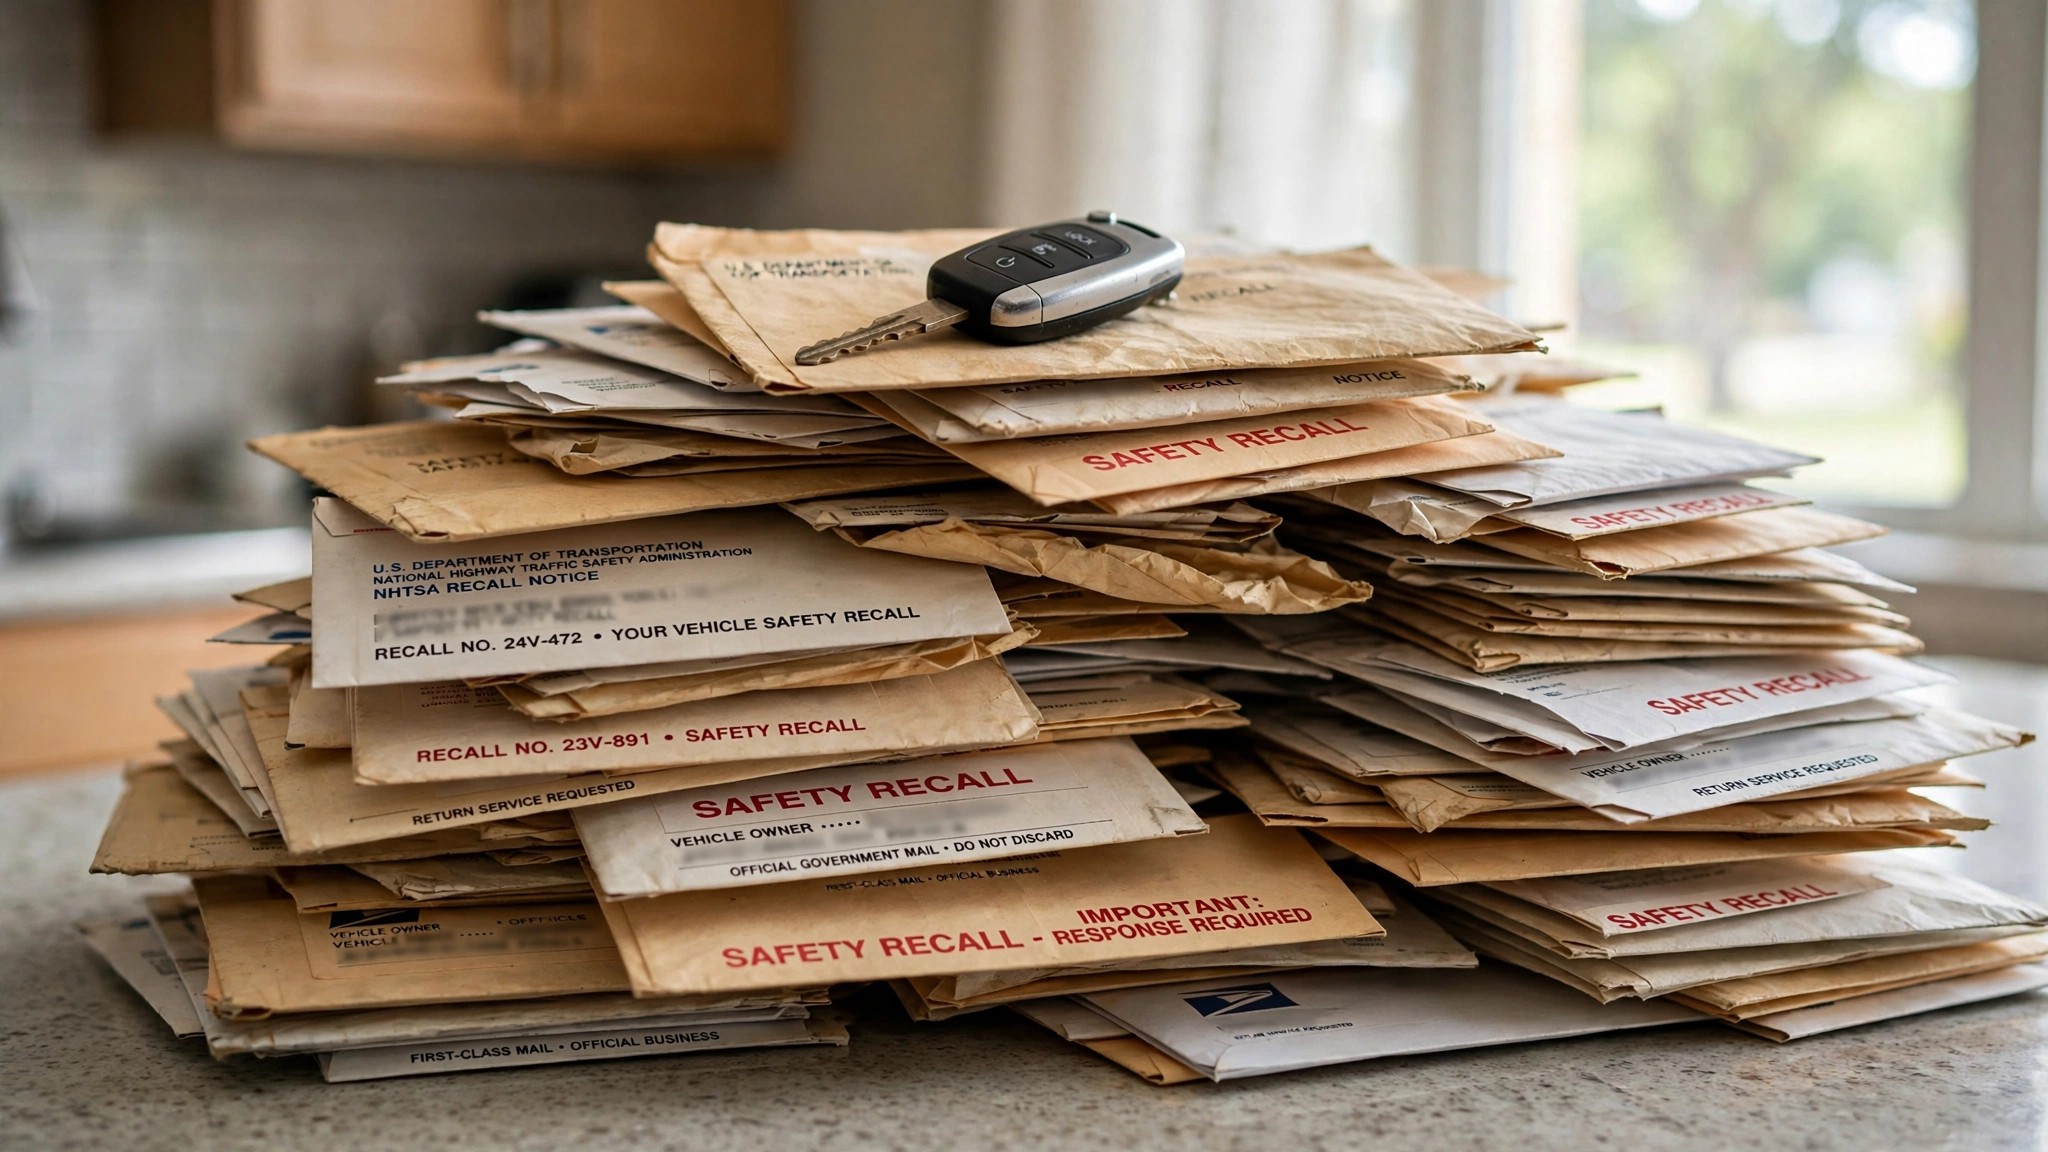
NHTSA issued 670 recall campaigns in 2025, covering more than 28 million vehicles. By February 2026, exactly half of them had been repaired. Fourteen million more are still on public roads, still carrying the defect that triggered the recall, still protected by absolutely nothing except a letter that may or may not have reached the right mailbox.[1]
A 50.3% completion rate sounds like a coin flip, and that's because it is one, but the aggregate number hides a far uglier curve underneath that explains why. For vehicles less than four years old, completion rates average 83%, which makes sense given that owners still have dealer relationships, maybe warranties, definitely working email addresses on file.[2] Drop to the 5-to-10 year bracket and completion craters to 44%, a number that should alarm anyone shopping for a certified pre-owned vehicle from 2019. Past ten years, it falls another 15 percentage points to roughly 29%, which means fewer than three in ten recalled vehicles in that age tier will ever see a technician who knows what's wrong with them.
The average age of a vehicle on U.S. roads is 11.4 years, putting the typical American car squarely in the worst completion tier on the curve.[3] NHTSA mails a letter to the registered owner, but the registered owner sold the car two years ago, and the new owner's address doesn't match anything in the manufacturer's database. The letter goes to the previous owner. The previous owner moved. The car keeps driving.
Now add tariffs to a system already struggling with compliance. S&P Global Mobility's 2026 aftermarket review documents $22.4 billion in added parts duties, with 47% of U.S. parts imports originating in Mexico, which translates to a 5% to 6% revenue hit on repair operations across the entire country.[4] Recall repairs are free to the consumer, but manufacturers eat the cost of parts and dealer labor, and when sourcing a replacement steering pump wiring harness gets 6% more expensive across a recall population of 1,076,999 Jeep Wranglers, what changes isn't the legal obligation but the boardroom urgency to expedite the fix.
NHTSA's own Report to Congress reveals another dimension that compounds the problem: vehicle segment matters almost as much as vehicle age. Large work vans hit 86% completion because fleet managers with 200 Sprinters have the repair scheduled before the notification letter arrives.[5] Premium sports cars sit at 31%, presumably because the Porsche owner who tracks their GT3 on weekends somehow cannot find time for a safety recall appointment between track days and detailing sessions.
Our recall system assumes rational actors responding to official notices about safety defects that could kill them. What it actually produces is a two-tier safety regime where newer, fleet-managed, warranty-covered vehicles get fixed while everything else rolls the dice, fourteen million times over, and the odds get worse every year the average fleet age ticks upward.
What You Should Do
If you own a vehicle older than five years, go to nhtsa.gov/recalls right now and enter your VIN, because if you bought used, the previous owner almost certainly ignored every recall letter that arrived at their old address. If your vehicle has an open recall, call the dealer and schedule it immediately since every recall repair is free regardless of the vehicle's age, mileage, or whether you're the original owner. If parts aren't available yet, ask the dealer to flag your VIN so you're contacted the moment they arrive.
Limitations
The 50.3% figure reflects completion rates at the eight-quarter reporting mark. Vehicles do get repaired beyond that window, so lifetime completion is higher than the snapshot suggests. NHTSA also notes that completion rates vary widely by manufacturer, defect severity, and parts availability, meaning the aggregate obscures both better and worse performers. We cannot isolate how many of the 14 million unrepaired vehicles are still registered and actively driven versus scrapped, exported, or parked. Tariff cost data reflects aggregate aftermarket impact and may not proportionally affect recall-specific parts sourcing at the same rate.
Counterargument
The strongest case for the current system: it works well for the vehicles that matter most, because newer cars with the highest safety-defect risk get fixed at 83%. Older cars dragging down the average are 10- and 15-year-old vehicles whose original defect may have been superseded by other age-related mechanical failures that make the recall seem trivial by comparison. A 2012 sedan with 180,000 miles has bigger problems than an unfixed recall from 2019, and its owner probably knows it. This is true, and it's also the argument for doing nothing while the problem compounds year over year. The completion curve isn't going up, the average fleet age isn't going down, and something besides a letter mailed to a stale address needs to happen.
Sources & References
- NHTSA, 2025 Annual Recalls Report (March 2026): 670 campaigns, 28M+ vehicles, 50.3% completion rate by February 2026. nhtsa.gov/recalls
- National Safety Council, Vehicle Safety Recalls: age-based completion rates (83% for <4yr, 44% for 5-10yr, ~29% for 10yr+). nsc.org
- S&P Global Mobility, Average Vehicle Age: 11.4 years as of 2023. spglobal.com/mobility
- S&P Global Mobility, 2026 Aftermarket Industry Review: $22.4B in added parts duties, 47% of imports from Mexico, 5-6% revenue impact. spglobal.com/mobility
- NHTSA, Report to Congress: Vehicle Safety Recall Completion Rates: segment-level data (86% work vans, 31% premium sports cars). nhtsa.gov