NHTSA Gave the Expedition Five Stars. IIHS Watched Its A-Pillar Rip Off.
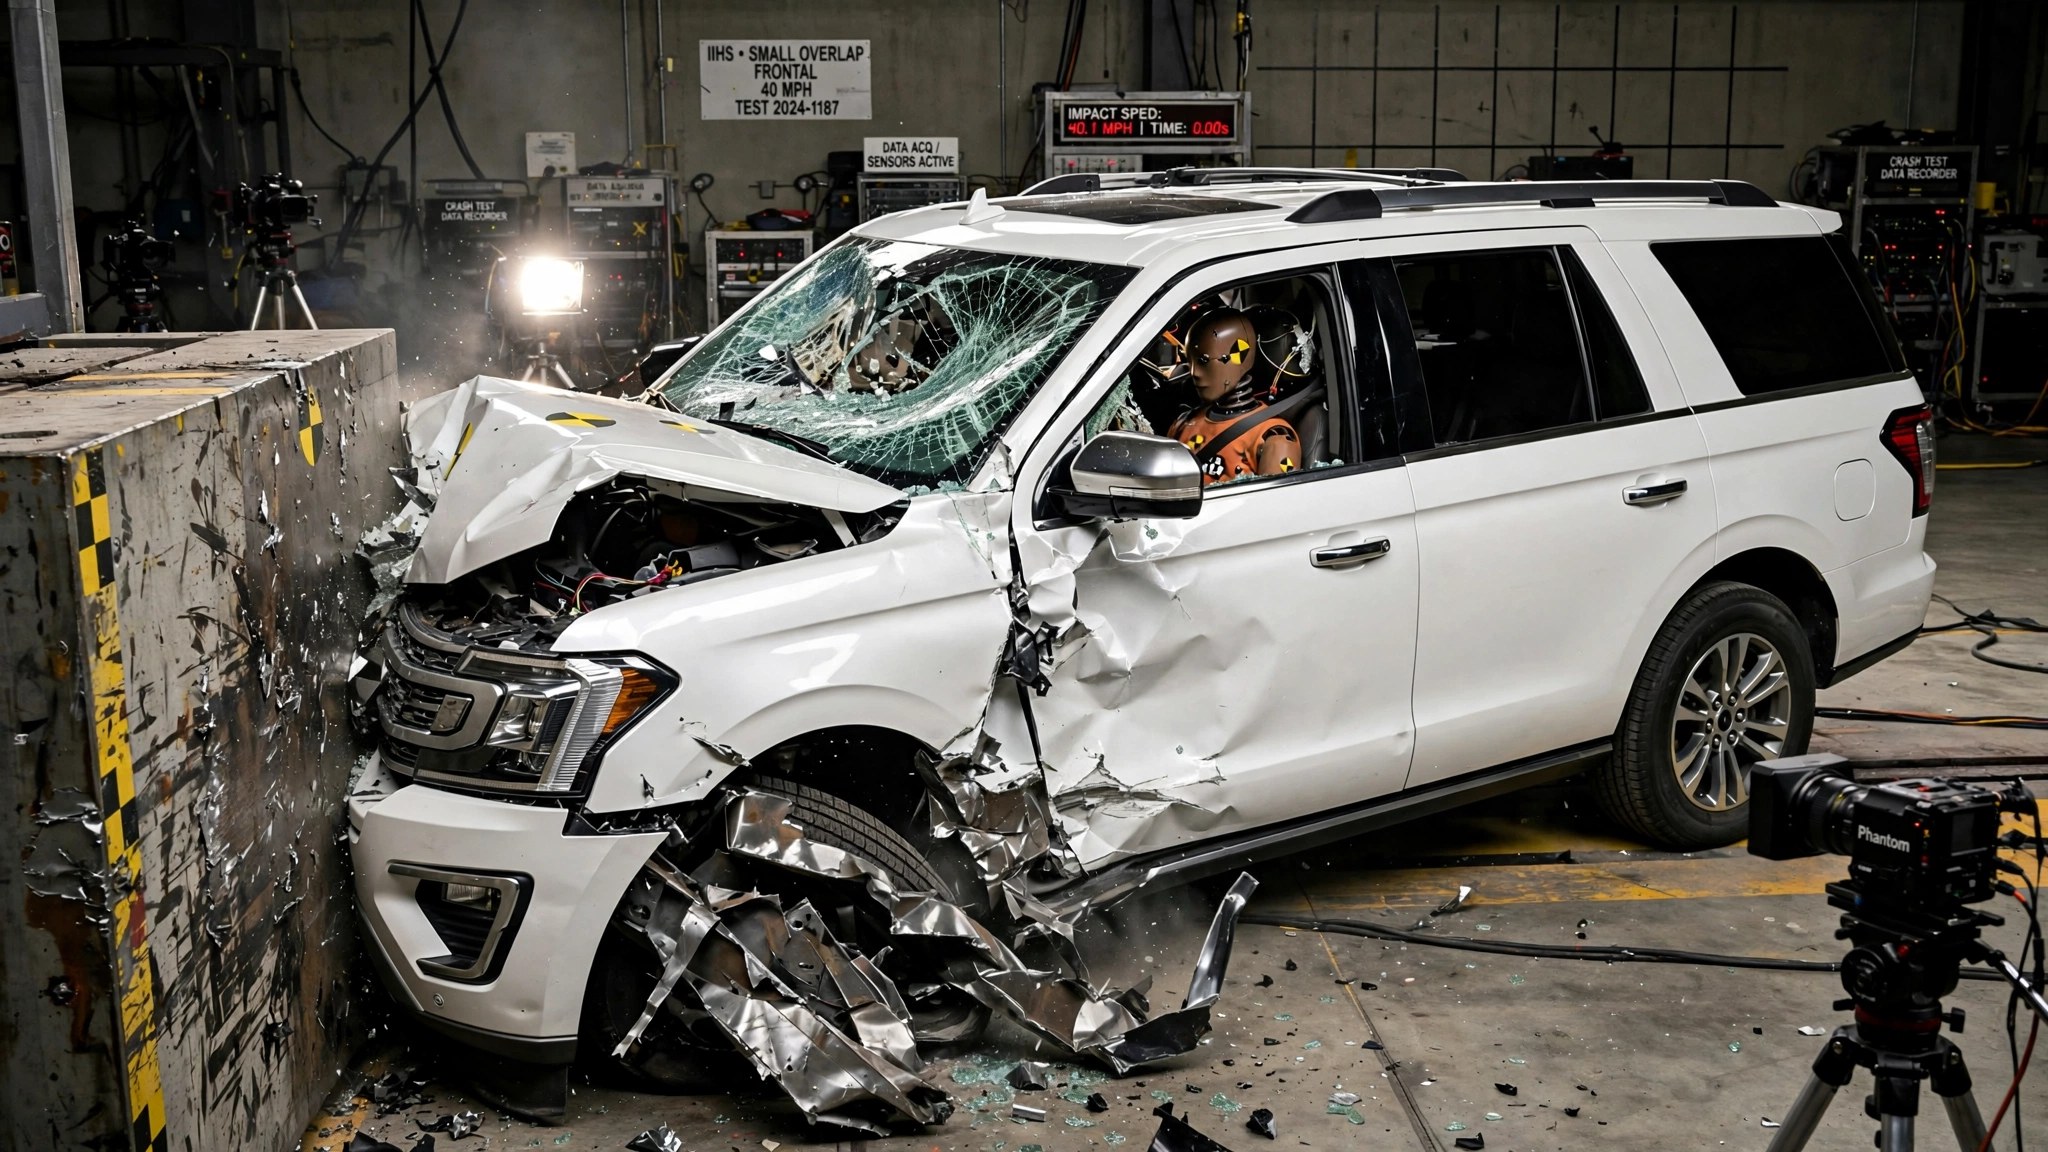
Two organizations crash-tested the Ford Expedition. One gave it the highest safety rating in its entire segment. The other watched the windshield roof pillar tear away from the floor.
NHTSA runs a 35-mph frontal barrier test and a side-pole impact, and by those measures the Expedition earned five stars overall, the only large SUV in the segment to claim that distinction.[1] Ford put that in the brochure and families bought accordingly.
IIHS runs a different gauntlet: small overlap, 40 mph, a quarter of the front end striking a rigid barrier simulating a tree or utility pole. In that test, the Expedition’s structure did not hold up. On both sides, the A-pillar separated from the rocker panel while the steering column partially detached from the instrument panel. Footwell intrusion was severe enough that the driver dummy registered a high risk of right-leg injuries and a moderate risk on the left.[2] IIHS scored it Marginal and called the structural performance “the sort of result we haven’t seen in years.”[3]
It got worse in the second row. When IIHS added a rear-seat dummy representing a 12-year-old to its updated moderate overlap test, the Expedition scored Marginal again because the rear curtain airbag failed to deploy and chest-injury risk from belt forces was high. The Chevy Tahoe scored Poor outright: the lap belt migrated onto the dummy’s abdomen, and head and neck injury measurements were elevated.[2] Not Marginal but Poor, on a vehicle families buy specifically to keep their children safe.
Ford’s response was that the Expedition “met or exceeded the regulatory requirements” of NHTSA.[3] Technically accurate, because NHTSA does not run a small overlap test or place a dummy in the second row, so its requirements never tested the crash mode that ripped the Expedition’s A-pillar off the floor pan.
FARS data puts real-world numbers behind the gap. From 2014 through 2023, the Expedition accumulated 1,515 occupant deaths across 2,641 fatal crashes, a fatality rate of 2.31 per 100 million vehicle-miles traveled.[4] Midsize SUVs carrying IIHS Top Safety Pick+ inhabit a different universe: the Kia Telluride posts 0.04, the Hyundai Palisade 0.06, the Mazda CX-5 0.12, yielding ratios of 19x to 58x against the Expedition’s rate. Mass protects you in a collision with a smaller vehicle, but it does nothing when your own A-pillar separates from the floor at 40 mph into a tree, and fixed-object crashes account for roughly a third of all fatal crashes nationwide.[5]
Ford will note, correctly, that body-on-frame trucks face different structural demands than unibody crossovers, and that fleet composition and driver demographics influence fatality rates. All fair. But over 90 percent of new vehicles score Good in the IIHS small overlap test, including cheaper trucks and SUVs.[3] Structural integrity in an offset crash is a solved problem for most of the industry, and Ford did not solve it for the vehicle it charges the most for.
If you own or are shopping for a Ford Expedition, Chevy Tahoe, or Jeep Wagoneer: Check both NHTSA and IIHS ratings before deciding. NHTSA’s stars reflect a 35-mph frontal barrier that does not replicate the offset crashes killing people on two-lane roads, and IIHS tests those crash modes directly. Of the three, only the Wagoneer earned a 2024 Top Safety Pick. All three scored Marginal or Poor when a second-row dummy was added. Midsize three-row SUVs with Top Safety Pick+ ratings exist at lower price points and dramatically lower real-world fatality rates.
Sources & References
- NHTSA, Safety Ratings: Ford Expedition. nhtsa.gov
- IIHS, “Jeep Wagoneer excels as other large SUVs falter in IIHS tests,” June 2024. iihs.org
- Consumer Reports, “Popular Large SUVs Struggle in Updated Crash Test.” consumerreports.org
- NHTSA, Fatality Analysis Reporting System (FARS), 2014–2023. nhtsa.gov
- IIHS, Fatality Facts: Collisions With Fixed Objects and Animals. iihs.org