DC Celebrated a 52% Safety Miracle. By August, It Was Gone.
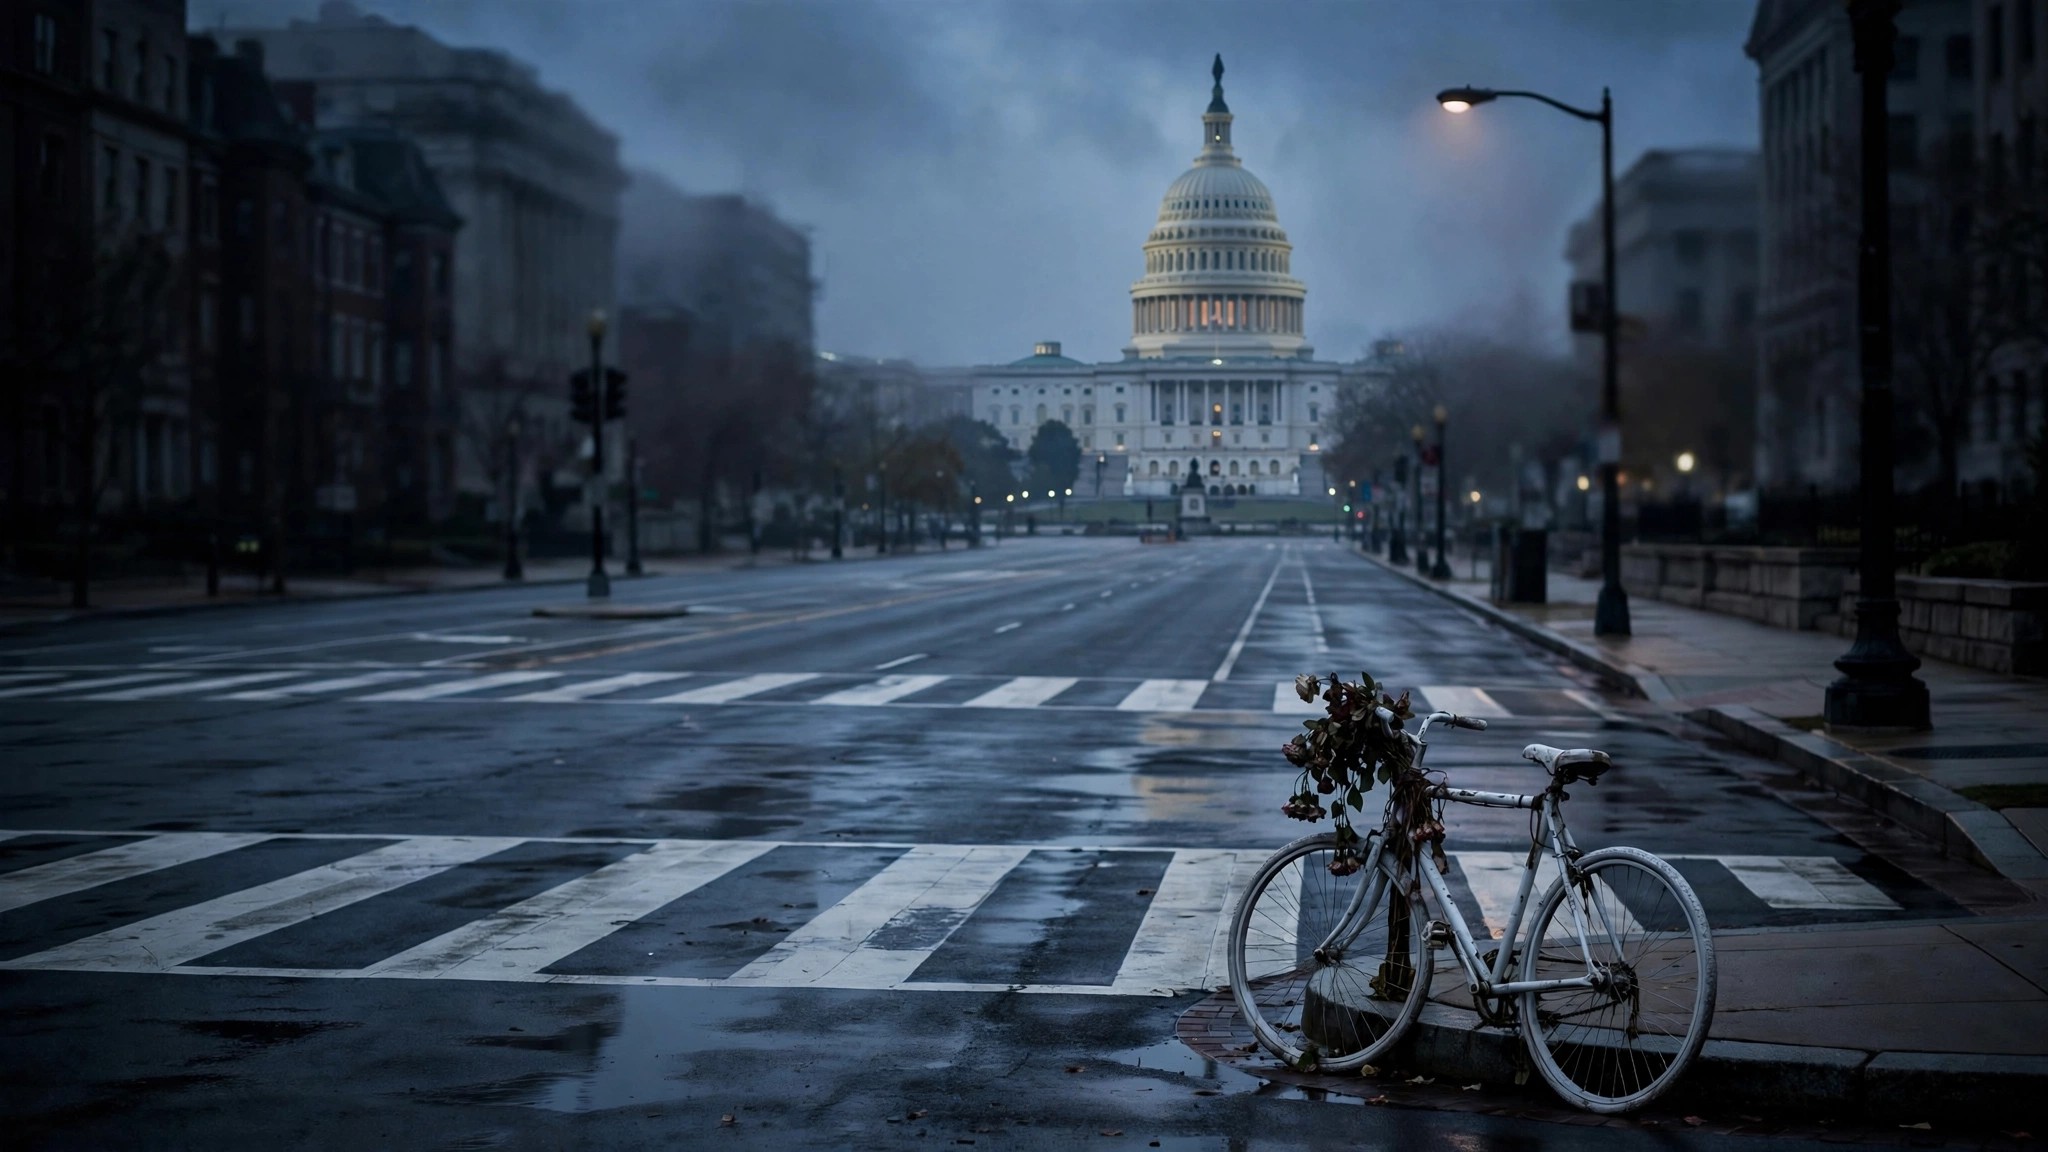
In April, the National Safety Council crowned Washington, DC with the largest traffic fatality reduction in America: a 52% plunge from 52 deaths in 2024 to just 25 in 2025.[1] Vision Zero advocates exhaled, press releases landed, and for one statistical moment the capital looked like a city that had finally cracked the formula for not killing its own residents with cars.
Seven months later, that miracle is already dead. DC has recorded 27 traffic fatalities through August 14, surpassing its entire 2025 total of 25 with four and a half months still to go.[2] At current pace the city tracks toward 43 deaths for the full year, which would erase every gain since 2021 and land right back in the range that prompted the celebration in the first place. Meanwhile, the rest of the country keeps improving: NHTSA's Q1 2026 estimate shows national fatalities down 4.3%, with the rate dropping below 1.0 per 100 million VMT for just the third quarter in recorded history.[3]
Nobody should be surprised, because DC has done this before with metronomic predictability, and the 20-year data from the Metropolitan Police Department makes the pattern impossible to miss. In 2012 the city hit a historic low of 19 deaths; by 2013 it had bounced to 29, a 53% rebound that precisely nobody in the transportation safety community seems to remember when praising the next dip. It touched 25 in 2010 and was back at 32 by the following year. In two decades of data, DC has never sustained a sub-30 year for two consecutive years.[2]
Why? Math, not policy. DC logs roughly 3.8 billion vehicle miles annually across 700,000 residents, and at that scale, a handful of high-severity crashes shifting from January to July, one drunk driver hitting pedestrians instead of a guardrail, three fatal motorcycle wrecks landing in the same month rather than being spread across four, can swing the annual total by double digits and transform a celebration into an embarrassment without a single policy variable changing. Separating signal from noise at these volumes is statistically impossible using single-year comparisons, yet every Vision Zero city does exactly that: celebrates a dip, credits its latest infrastructure project, and goes quiet when the rebound arrives.
DC adopted Vision Zero in 2015 with an explicit target of zero deaths by 2024.[4] Since then, annual counts read: 26, 28, 30, 36, 27, 37, 40, 35, 52, 52, 25. Fit a trendline honestly and it points up. Calling 25 a breakthrough rather than regression toward a mean that happens to sit below a two-year disaster plateau at 52 requires motivated reasoning, a short memory, and a willingness to confuse randomness with progress.
Counterargument at full strength: DC installed 89 speed cameras since 2019 and redesigned high-crash corridors along Georgia Avenue and New York Avenue, and defenders argue those interventions measurably reduced severity on the specific corridors where they were deployed. Probably true. But corridor-level wins coexist with system-level stagnation when fatalities migrate to the next most dangerous segment, a phenomenon researchers call risk homeostasis, and until cities measure network-wide outcomes rather than corridor-level victories the evidence base for Vision Zero's effectiveness remains genuinely contested.
What you can do: If you drive, walk, or bike in DC, the highest-fatality window runs dusk through midnight on wide multi-lane arterials in Southeast and Northeast, not the congested downtown grid where speed is physically constrained by traffic. If you evaluate city safety records for policy purposes, demand five-year rolling averages for any jurisdiction logging fewer than 100 annual fatalities, because a single good year is not evidence of anything except a single good year. DC just proved that again.
Limitations: DC MPD data through August 14, 2026 is preliminary and subject to reclassification. VMT estimates from FHWA may lag one to two years. Annualized projection assumes second-half pace matches first half, which seasonal patterns do not guarantee. DC is an urban-only jurisdiction; national comparisons include rural roads carrying fundamentally different risk profiles, higher speeds, and lower emergency response times.
Sources & References
- National Safety Council, Preliminary Motor Vehicle Fatality Estimates, 2025, February 2026. DC recorded the largest decline at 52%. programbusiness.com
- DC Metropolitan Police Department, Traffic Data, updated August 14, 2026. 20-year fatality trend and year-to-date comparison. mpdc.dc.gov
- NHTSA, Traffic Crash Deaths: Early Estimates, January–March 2026. Q1 fatality rate of 0.99 per 100M VMT; 7,770 deaths, down 4.3%. nhtsa.gov
- Government of the District of Columbia, Vision Zero DC, adopted 2015. Goal of zero traffic deaths and serious injuries. mpdc.dc.gov
Source: DC Metropolitan Police Department traffic data through August 14, 2026; NHTSA early estimate Q1 2026; NSC preliminary 2025 data. Year-to-date comparisons are preliminary. See methodology for caveats.