We Built a Two-Variable Risk Index for Every Car in FARS. The Spread Is 57x.
A car can kill you in two fundamentally different ways. The metal around you can crumple wrong. Or the person behind the wheel can show up impaired. Most safety analyses pick one variable and run with it. We picked both.
Take every vehicle in the FARS database with 200 or more fatalities over the 2014–2023 window. Cross-reference its death rate per 100 million VMT against its impairment rate from toxicology reports. Normalize impairment to the national fatal-crash average of roughly 20%. Multiply. The result is a compound risk score that captures both the engineering and the behavioral dimension of danger in a single number.
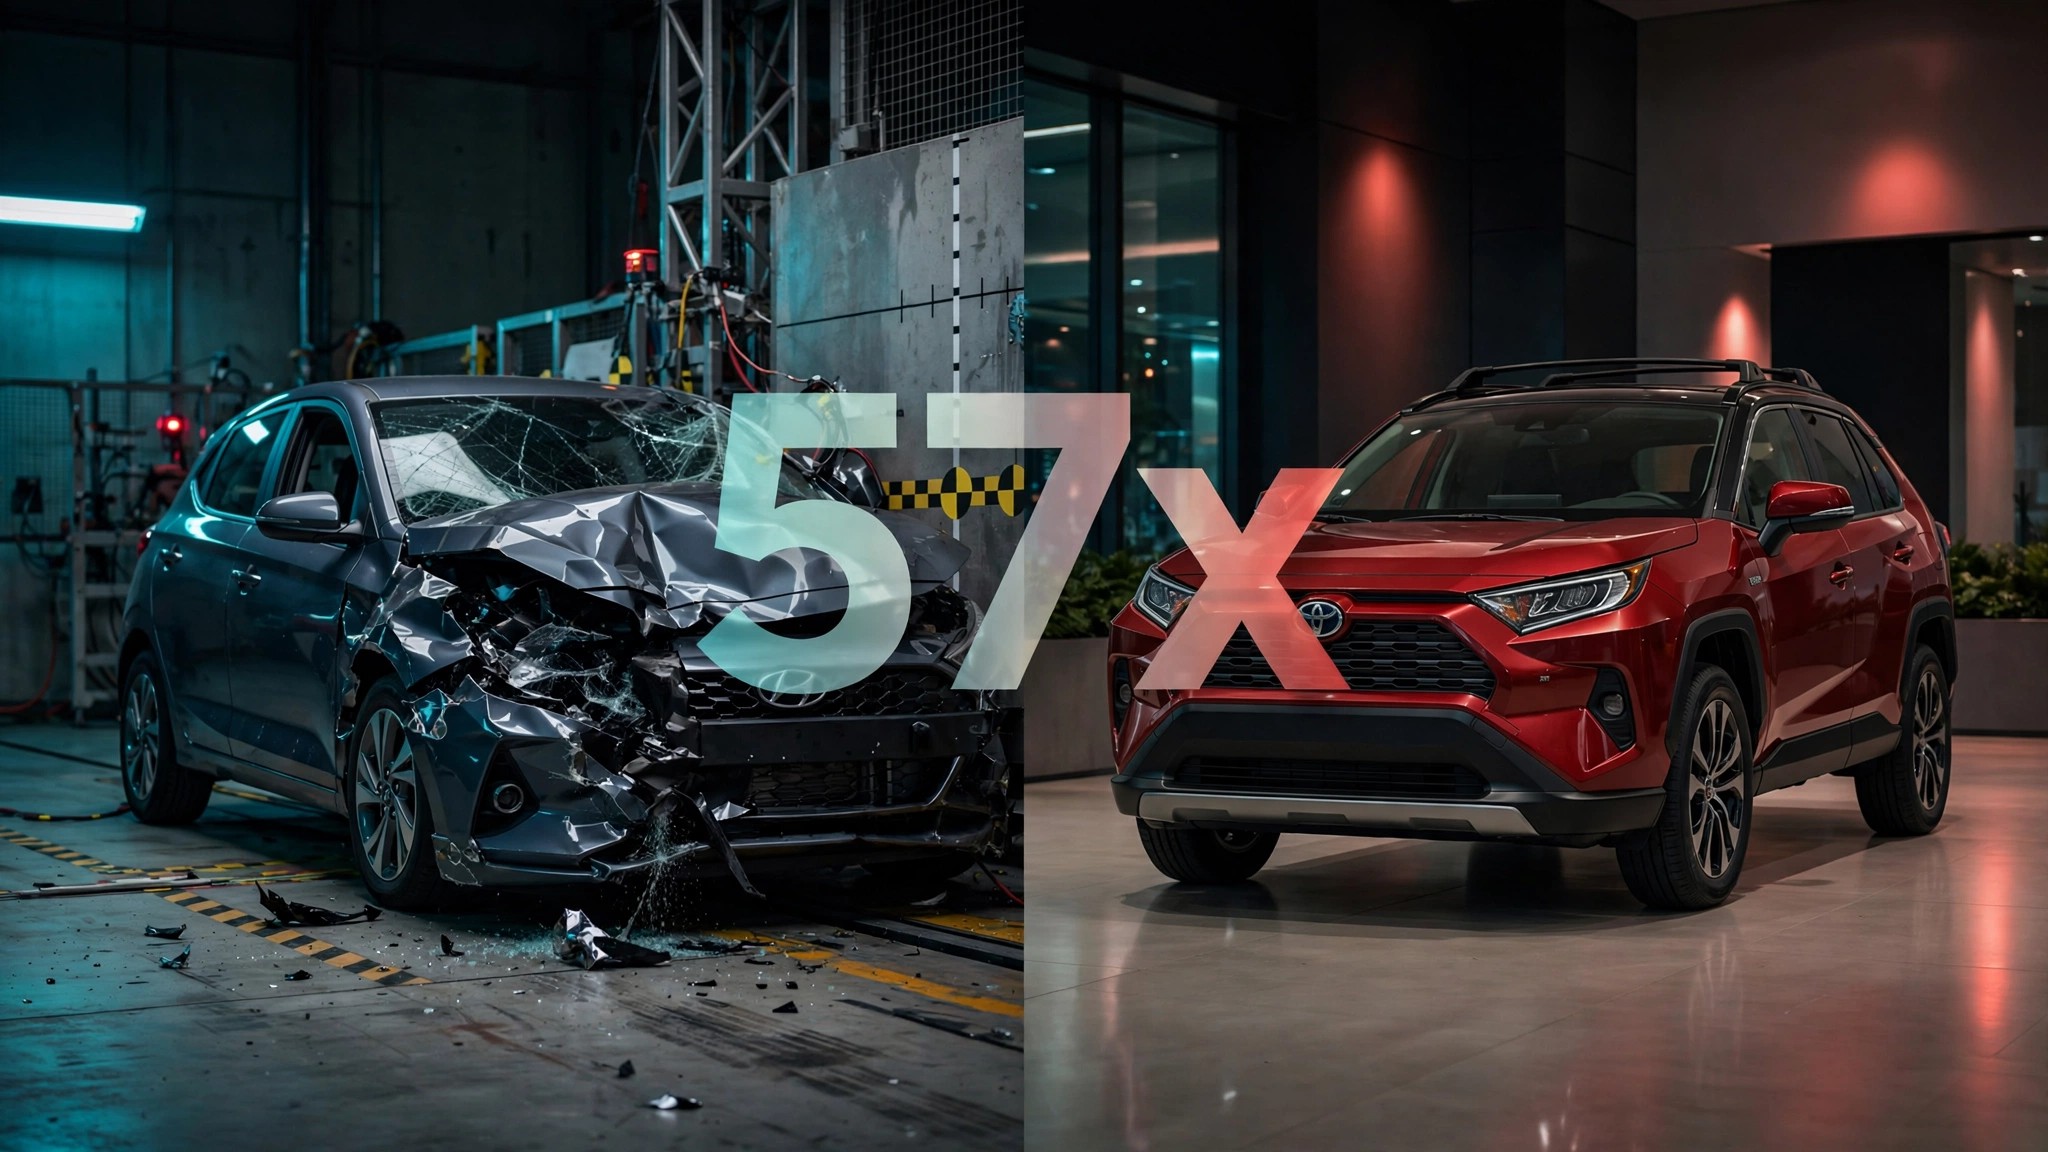
Hyundai's Veloster tops the list at 7.43. Ram's 1500 sits at the bottom at 0.13. Same American roads. Same decade. Fifty-seven times the combined risk.
What the index actually reveals is a taxonomy. Vehicles cluster into four quadrants, and each quadrant tells a different story about why people die.
Quadrant 1: The car is the problem. Veloster (rate 8.54, impairment 17.4%), Chevrolet Tracker (7.83, 12.7%), Toyota Land Cruiser (6.27, 8.9%). These vehicles have death rates 4–8 times the national average, but their drivers are less impaired than normal. Veloster's impairment rate is below the FARS mean. Land Cruiser's is less than half. Sober people climb into these vehicles and die anyway, at rates that would alarm an actuary.[1]
Quadrant 2: The driver is the problem. Chevrolet Camaro (rate 3.44, impairment 23.0%), Buick LeSabre (2.67, 23.5%), Chevrolet Corvette (1.52, 26.2%). Corvette doesn't crack the top 10 despite having the highest impairment rate of any vehicle with 200+ deaths. One in four Corvette drivers in fatal crashes was impaired.[2] But the car itself is built well enough to keep the rate from exploding. LeSabre tells a grimmer version: an aging sedan whose demographics skew toward impaired driving, with structural integrity that was mediocre when Reagan was president.
Quadrant 3: Both are the problem. Ford Mustang (rate 6.02, impairment 21.9%, compound score 6.59), Chevrolet Cobalt (5.10, 22.4%, score 5.71), Chevrolet Impala (5.00, 21.4%, score 5.35). Mustang kills because it's a rear-drive performance car with a demographic that drinks, and because physics punishes spinouts. Cobalt kills because GM built it with an ignition switch that could shut off airbags mid-crash, and its drivers were 12% more likely to be impaired than the fleet average. A sedan with a compound score higher than the Camaro. That should bother someone at GM.[3]
Quadrant 4: Neither. Toyota RAV4 (rate 0.19, impairment 18.4%, score 0.17), Chevrolet Equinox (0.36, 19.4%, score 0.35), Toyota Highlander (0.42, 16.4%, score 0.34). Modern crossovers with competent crash structures, driven by demographics that trend sober. RAV4's compound score is 43 times lower than the Veloster's. Buy the RAV4.
General Motors owns seven of the top 15 compound risk vehicles. Cobalt, Impala, Tracker, S-10 Pickup, Camaro, Trailblazer, Cavalier. A company that spent $600 million on Super Cruise development put more vehicles in the danger zone than any other manufacturer.[4] Most of them are discontinued. Bodies keep accumulating.
Sources & References
- NHTSA, Fatality Analysis Reporting System (FARS), 2014–2023. Death rates estimated per 100M VMT using NHTS mileage data and industry fleet estimates. nhtsa.gov
- FARS Toxicology data, 2014–2023. Impairment defined as BAC > 0 or drug-positive toxicology in drivers involved in fatal crashes. National average approximately 20%. cdan.dot.gov
- GM ignition switch recall, 2014. Linked to at least 124 deaths. Cobalt and other models had defective ignition switches that could move to “accessory” position during driving, disabling airbags and power steering. Wikipedia
- GM investor relations and ADAS development expenditure disclosures, 2017–2024. Super Cruise cumulative R&D estimated at $600M+. nhtsa.gov
Limitations
Fleet age confounds both variables. Older vehicles have worse crashworthiness (inflating the rate) and their demographics skew toward higher impairment (inflating the behavioral component). Compound scores partly capture "old car driven by high-risk demographic" rather than two independent failure modes. VMT estimates carry ±15% uncertainty for low-volume models. Impairment rates reflect only fatally-crashed drivers, not all drivers of that vehicle. A Veloster, with an estimated fleet of 87,500, has higher statistical variance than an F-150 at 6.5 million.
What to Do
If you own a Quadrant 3 vehicle, check your VIN at nhtsa.gov/recalls. Cobalt has an open recall. Mustang has three. Impala has two. If you're shopping, the bottom of the compound index is dominated by midsize crossovers under $35,000. Engineering and demographics align. RAV4, Equinox, and Tucson are not exciting. They are also not killing their drivers at 43 times the compound rate of the alternatives.