The Brand Lethality Index: Ranking Every Automaker by Whether You Survive the Crash
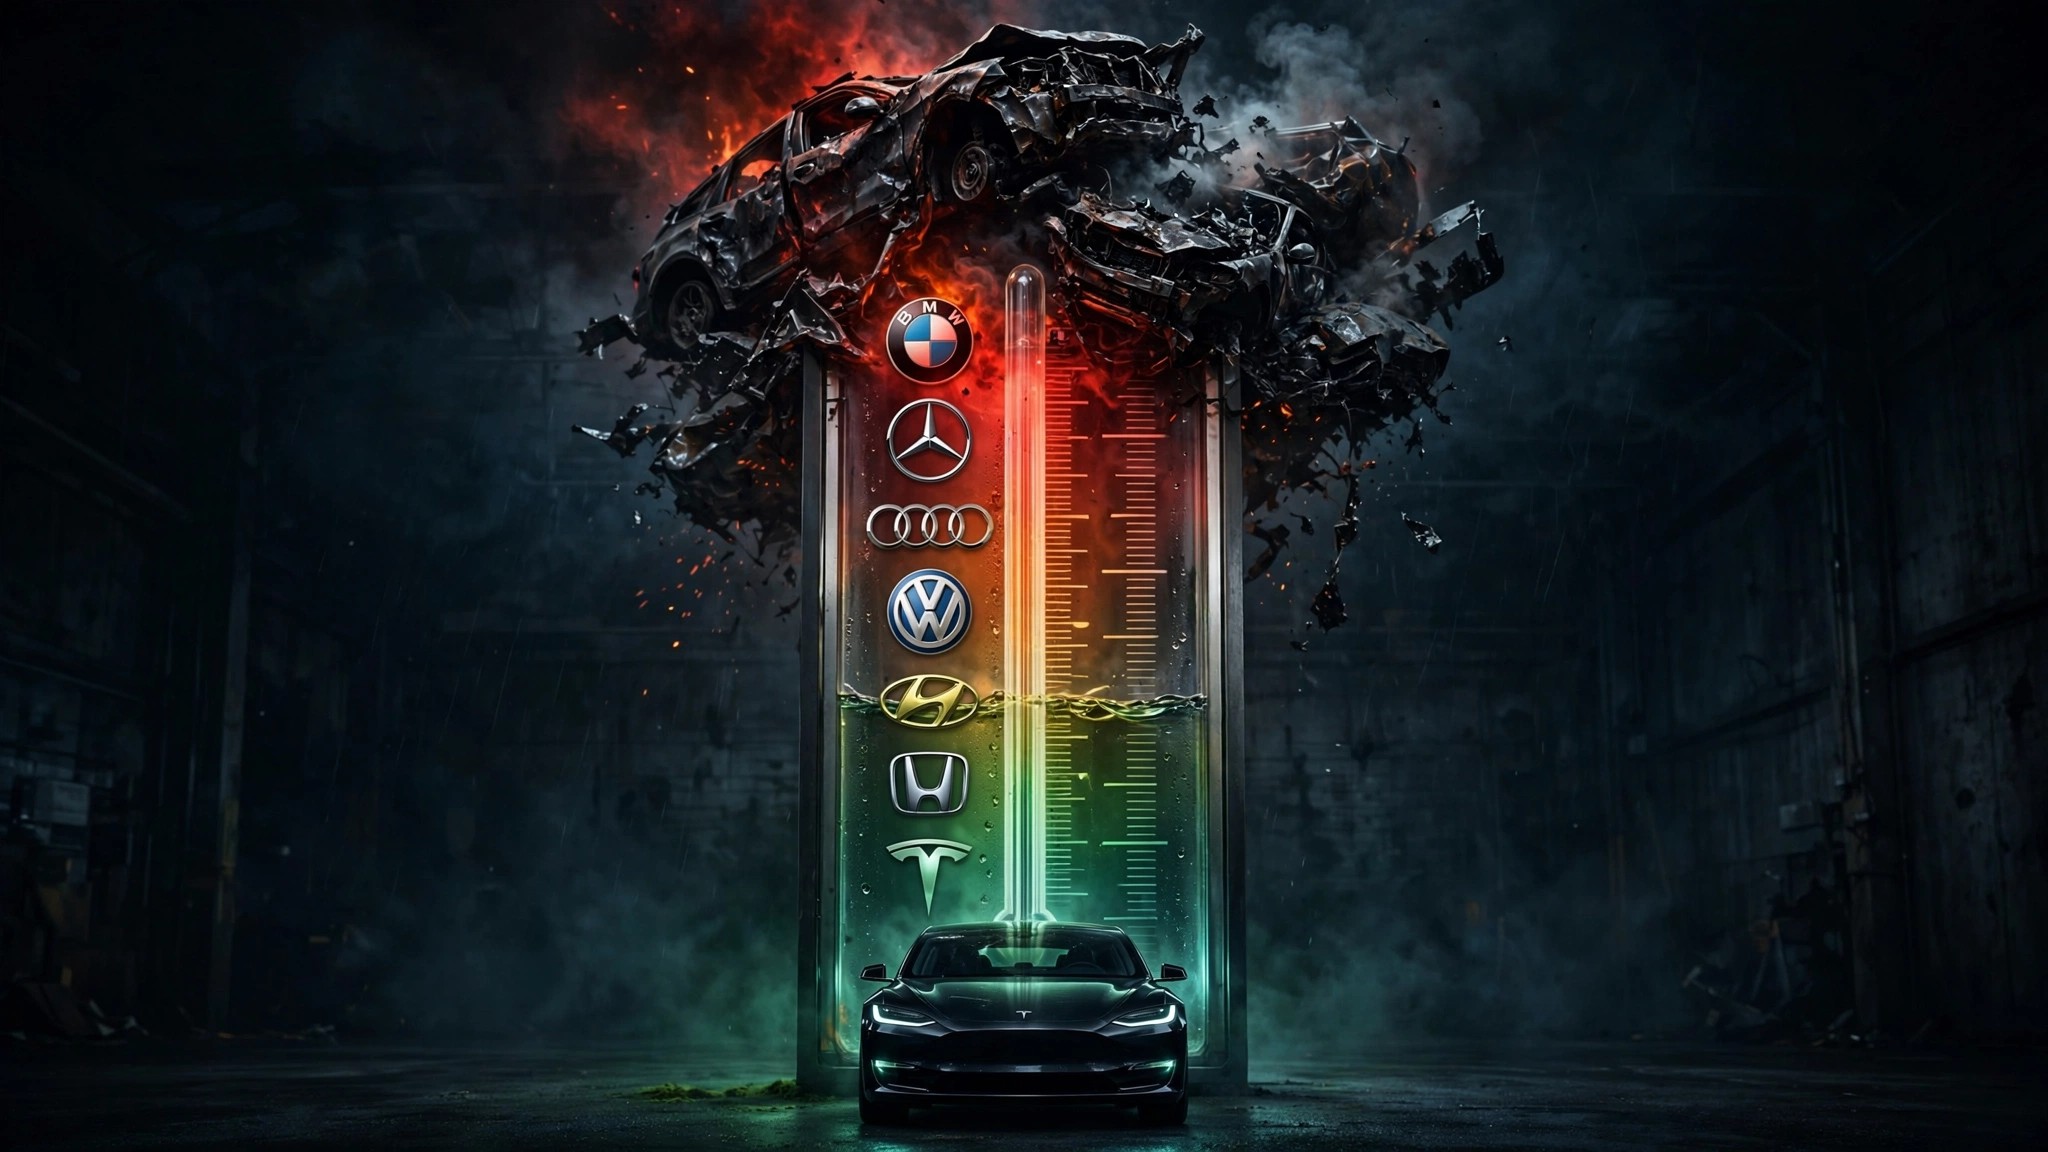
Everyone measures safety wrong. Total deaths just reflect fleet size. Deaths per mile blend the vehicle with the driver. Neither answers the question that matters once the airbags deploy: when this brand's car crashes, does the occupant live?
I divided deaths by crashes for every brand with 1,000+ fatal involvements in FARS 2014–2023.[1] Fleet average: 56.9% of crashes kill. Pontiac sits at 73.8%. Ram at 30.5%. Same country, same roads, same decade. A 2.42x gap in whether the crash is survivable.
Honda is the surprise. Sixth-deadliest brand at 61.7%, above Nissan (61.1%), Chevrolet (58.8%), and Toyota (56.2%). Civic, Accord, and Fit drag the portfolio upward. Lighter sedans with older fleet mixes produce crashes that kill more reliably than the vehicles Honda markets against.
At the bottom, where survival odds are best: Ram (30.5%), Mercedes-Benz (47.0%), Jeep (49.6%). Ram's advantage is physics. Mass wins multi-vehicle collisions.[3] Full-frame trucks distribute impact energy across structures built to tow 10,000 pounds. Sedans absorb it with the passenger compartment.
GM's position deserves its own line item. Thirteen of 24 models with per-crash lethality above 70% carry a GM badge: Cobalt (80.8%), Cavalier (85.7%), Corvette (88.4%), S-10 (75.5%), Sonic, Spark, HHR, Blazer, LeSabre, Century, Grand Am, Grand Prix, Sonoma. Combined, an estimated 2,972 deaths above what fleet-average lethality would predict for the same crashes.
Fair counterargument: fleet age. Dead brands like Pontiac and Mercury have only old cars, and old cars crumple badly. But among brands still selling new vehicles, the gap is still 2.0x: Honda at 61.7% versus Ram at 30.5%. Class mix is part of that. Honda sells sedans. Ram sells trucks. Choosing which class of vehicle to build is itself a design decision with a body count.[2]
What to do with this: Check where your brand falls. If it sits above 56.9%, factor that into your next purchase. Below it, your badge is already pulling some weight. And if you are shopping Honda against Toyota, know this: IIHS lab scores are almost identical, but in actual fatal crashes, Honda kills at a rate 10% higher. Same showroom. Different morgue.