The Brand Badge Is a Lie. Your Model Choice Is a 39x Safety Gamble.
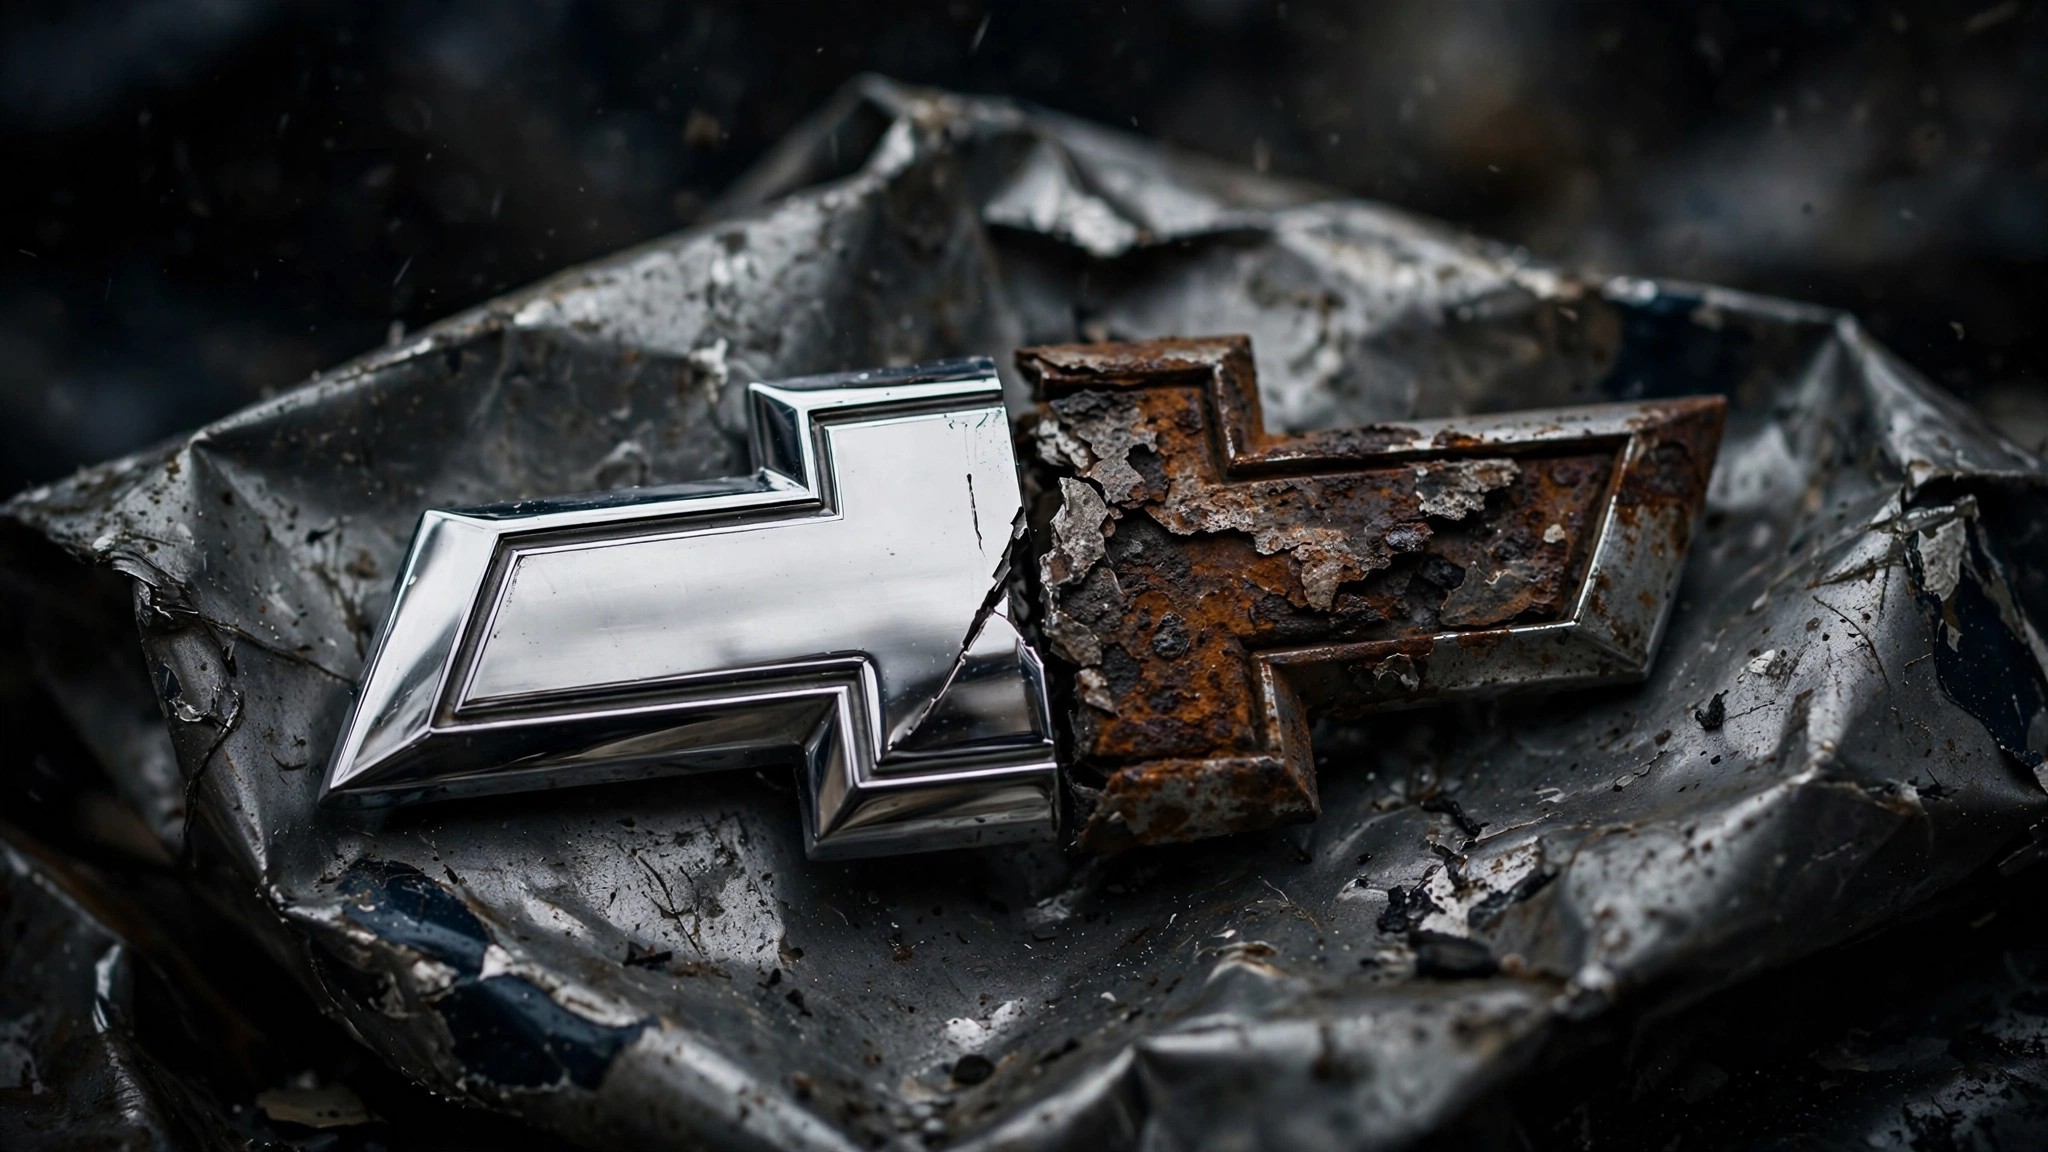
Chevrolet sells 25 models that appear in the FARS database with enough fatalities to calculate a meaningful rate. The safest, the Traverse, kills its occupants at 0.20 deaths per 100 million vehicle miles traveled, a rate so low it barely registers against the background noise of American driving. The deadliest, the Tracker, clocks 7.83, which puts it in the same statistical neighborhood as riding a motorcycle through a Louisiana bayou at midnight without a helmet. Same bowtie on the grille, same dealer network, same corporate parent sweating quarterly earnings in Detroit. One is 39 times more likely to kill you than the other.
That ratio sat buried in the FARS data for a full decade before anyone bothered to divide the column by the manufacturer instead of by vehicle class, which is how the safety establishment has always sliced this dataset, because class comparisons produce tidy charts and brand comparisons produce uncomfortable questions about what a logo actually promises. We computed intra-brand safety spreads for every manufacturer with at least three models carrying 200 or more fatalities in the 2014–2023 window. The results demolish the one piece of car-buying advice everyone thinks they know.
Toyota runs a 33x spread, anchored at the bottom by the RAV4 at 0.19 and at the top by the Land Cruiser at 6.27. Both are SUVs, both wear the same badge, and both sit on Toyota's website under the same corporate safety messaging, and both are sold by the same salesperson in the same showroom on the same afternoon to buyers who believe they are purchasing into a safety culture, when what they are actually purchasing is a specific model whose fatality rate varies by a factor of 33 depending on which key fob they pick up.[1]
Hyundai stretches to 25.1x between the Tucson (0.34) and the Veloster (8.54). Nissan hits 14.6x, and Ford spans 14x, from the F-250 (0.43) to the Mustang (6.02). These are not decimal-place quibbles or rounding artifacts that disappear when you squint at the confidence intervals; they are order-of-magnitude gulfs that would survive any reasonable sensitivity analysis, sitting inside a single manufacturer's showroom floor where every vehicle carries the same warranty card and the same corporate safety pledge.[1]
The counterargument writes itself. Of course a Mustang kills its driver more than an F-250, sports car versus heavy-duty truck, which is precisely why you control for class. Toyota's 33x spread exists between two vehicles the industry classifies identically as SUVs, which means the class variable is held constant and the spread persists, which means something other than class is doing the killing, and that something is emphatically not captured by the brand name on the trunk lid.[2]
Now look at the other end of the spectrum, where a few manufacturers actually deliver on the implicit promise that their badge means something. Subaru's entire lineup spans 3.7x, from the Forester (0.26) to the Legacy (0.95), a range narrow enough that any model you buy is within a survivable band. Kia, a brand Americans still reflexively distrust despite a decade of improved crash test ratings, covers 3.8x from the Sportage (0.28) to the Rio (1.07), meaning even Kia's worst model kills at a lower rate than the average Toyota sedan, while Infiniti compresses to a near-negligible 1.3x across its entire lineup. These are the manufacturers where the badge encodes real information about engineering consistency rather than marketing aspiration.[1]
Here is the number that should end every dinner-party conversation about "safe brands" forever: Toyota's internal spread (33x) is larger than the gap between Toyota's safest model and Kia's deadliest (5.6x), which means "buy a Toyota" is six times less informative than "buy the right model from any brand." The heuristic is not merely imprecise; it is actively worse than model-level selection from a brand most people would consider inferior.
A 2024 study in Traffic Injury Prevention, coauthored by IIHS researchers, found that the protective benefit of vehicle weight plateaus at around 4,000 pounds with negligible incremental gains above that threshold, and a MedRxiv preprint examining the same IIHS size categories noted "huge variation in driver death rates and little relation between the rates and vehicle size" within each category, which means even the within-class comparison that IIHS prefers reveals the same pattern we found at the brand level: the label on the container predicts almost nothing about what is inside it.[2][3]
Caveats, because this analysis has real ones. FARS captures only fatal crashes, so a model with a low fatality rate might still send you to the ICU at alarming frequency; we cannot see injury crashes in this dataset and do not pretend otherwise. The VMT denominators are estimates built from fleet size multiplied by average annual miles, introducing roughly ±15% uncertainty for low-volume models where the denominator is small enough for estimation error to matter. Some high-spread brands are partly inflated by discontinued models still circulating in an aging fleet: the Chevy Tracker left production in 2004, its 7.83 rate reflects a vehicle designed before the ESC mandate and still being driven by people who cannot afford to replace it, and removing all discontinued models from the analysis drops Chevrolet's spread substantially but leaves Toyota's intact because the Land Cruiser is still in production.
The strongest counterargument against this entire analysis is demographic confounding, stated at full strength: the Mustang's fatality rate is partly a Mustang problem and partly a "who buys Mustangs" problem, because young male drivers with aggressive driving habits and a statistical taste for wrapping themselves around telephone poles at 2 AM cluster around certain models in ways that no amount of structural engineering, airbag count, or five-star rating will ever fully erase. That is a real and serious limitation of any observational analysis built on FARS data, and it is also precisely the point. The brand badge hides a demographic fingerprint that the model name reveals, and if the manufacturer cannot control who its product attracts or how they drive it, then the brand's safety reputation is a marketing fiction that the model's actual body count punctures every single year.
Check your specific model's fatality rate before you trust the logo. Subaru and Kia are the most internally consistent lineups in the FARS dataset, meaning any model you pick from either brand will land within a narrow survivability band. If you drive a Chevrolet, know that the bowtie covers a 39-fold range between the safest and deadliest thing GM bolts it onto. And if someone at your next dinner party tells you to buy a Toyota for safety, ask them which Toyota, because the answer to that question matters 33 times more than the answer to "which brand."
Sources & References
- NHTSA, Fatality Analysis Reporting System (FARS), 2014–2023. Intra-brand spread ratios computed from per-model fatality rates (deaths per 100M VMT). nhtsa.gov
- Mueller, Zuby, Nolan. “Crash incompatibility between cars, SUVs, and pickups in 2017–2022.” Traffic Injury Prevention, 2024. Weight benefit plateaus at 4,000 lb. PubMed 40100638
- Robertson, L. “Vehicle safety tests, rankings, curb weight, and fatal crash rates.” MedRxiv preprint. Noted “huge variation in driver death rates and little relation between the rates and vehicle size” within IIHS categories. medrxiv.org
- IIHS, Fatality Statistics: Fatality Facts. iihs.org