The 100 Deadliest Days Are Getting Safer. Unless You're 16.
Summer 2024 killed 10,438 people on American roads. That is 926 fewer than two summers earlier, an 8.1% decline that NHTSA would love you to focus on,[5] and you should not.[1]
Focus on the 635.
That is the number of fatal crashes involving a driver aged 15 to 20 in summer 2024, up from 542 two years prior. A 17.2% increase. Teens are the only age group that worsened, and they worsened in both consecutive years of the study period, which means this is not statistical noise bouncing around small counts.[1] It is a trend, and it is accelerating. Teen drivers went from 4.8% of summer road deaths to 6.1% in twenty-four months.
Texas led the slaughter with 68 teen summer fatalities. Arizona nearly doubled its count from 12 to 23. Meanwhile, the national headline celebrated the progress nobody in that age bracket actually experienced.
The fleet age problem nobody discusses
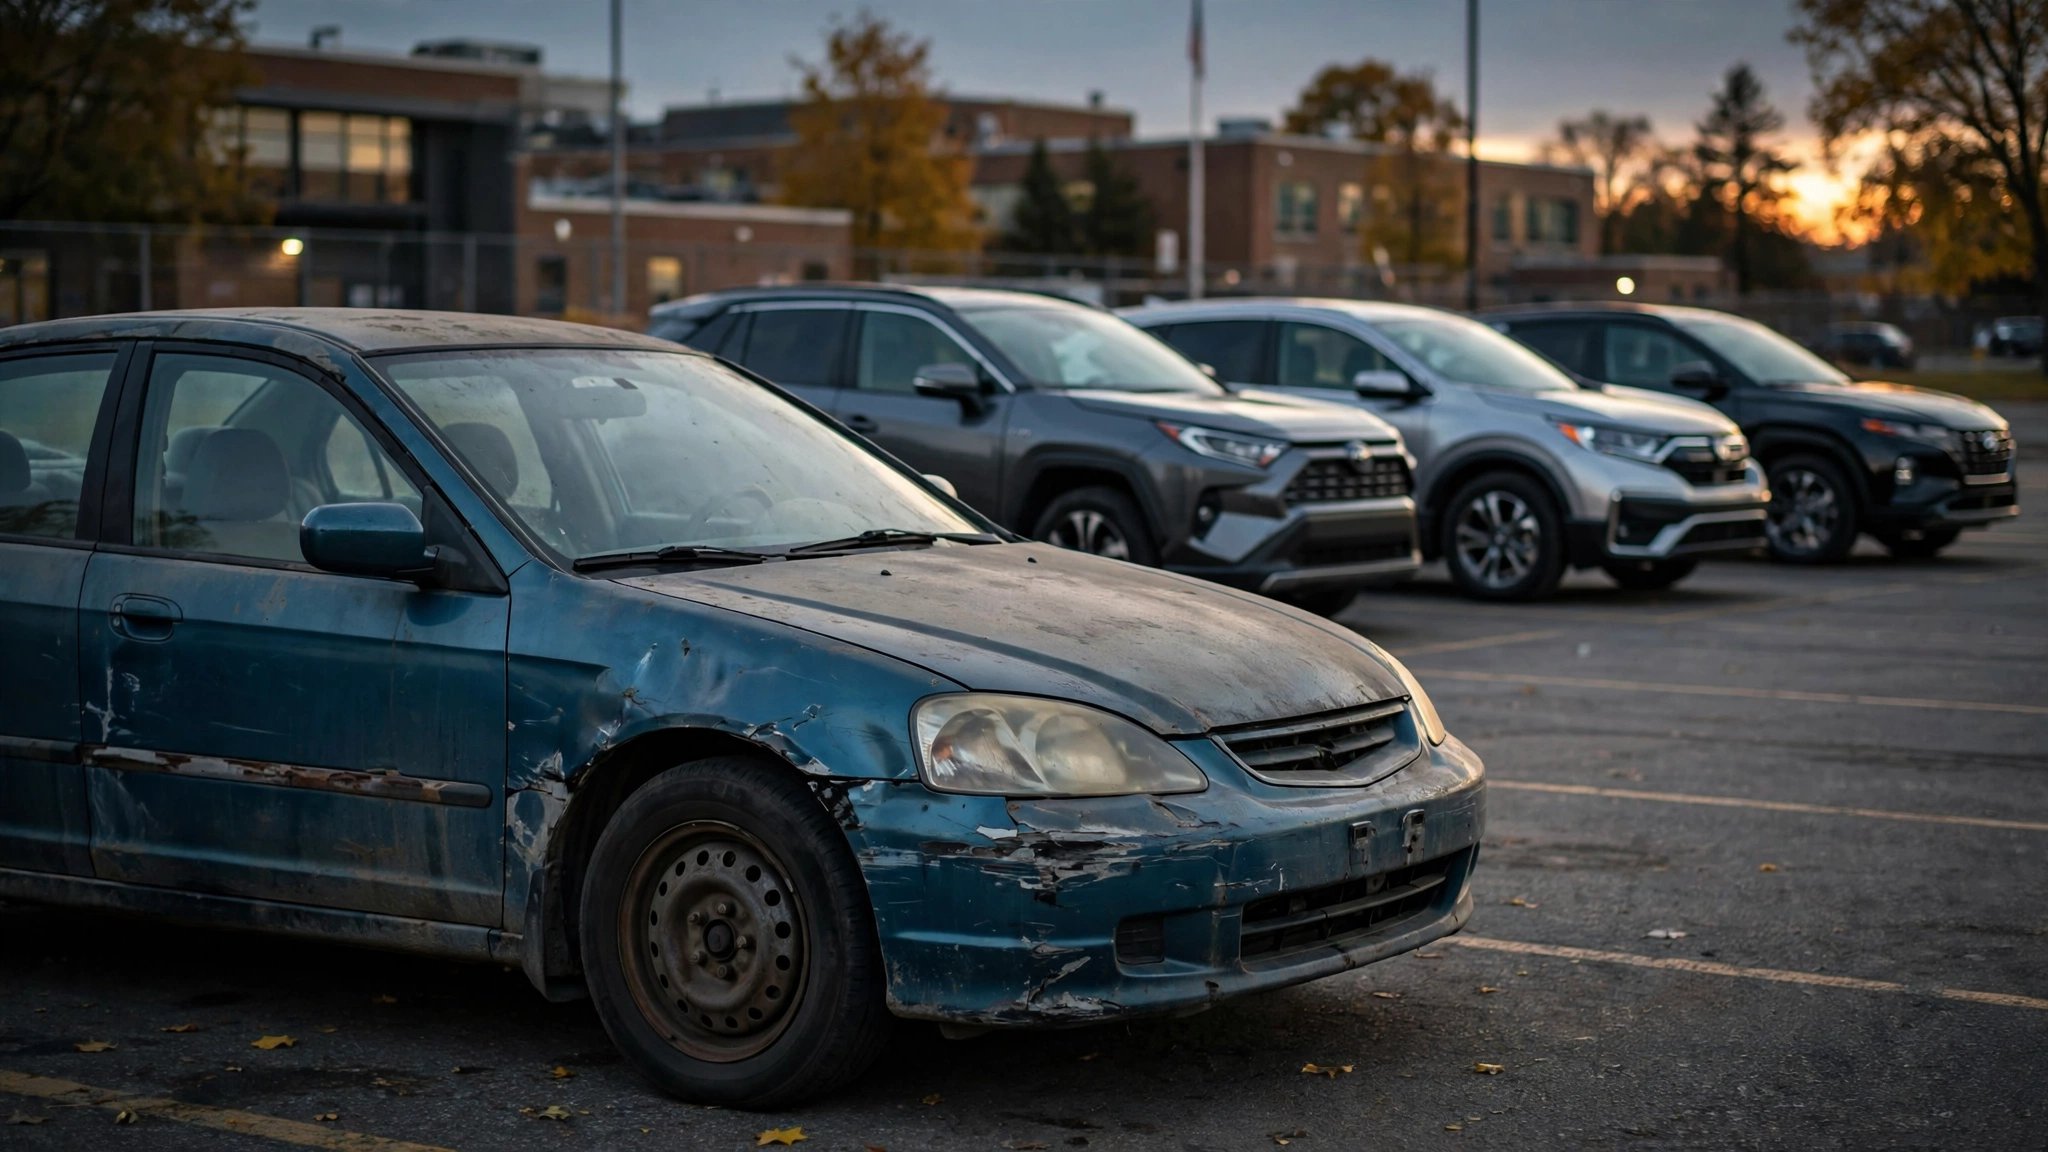
A sixteen-year-old does not drive a 2026 Hyundai Tucson with AEB, forward collision warning, lane-keeping assist, and pedestrian detection. A sixteen-year-old drives whatever their parents stopped wanting. In practice, that means a 2010 Honda Civic, a 2012 Nissan Altima, or a 2008 Toyota Camry.[2]
Check our FARS data on those vehicles. That Civic logged 6,553 deaths over the study period at a rate of 2.25 per 100 million VMT, the Altima posted 4,787 deaths at a rate of 2.88, and the Accord reached 7,102 deaths at 3.07.[3] Peak model-year death counts cluster in exactly the vintage a teen would inherit: 2006 through 2012, when those sedans were selling by the millions and shipping without any form of automatic emergency braking.
Meanwhile, the vehicles pulling the national average down are the ones teens cannot afford. A RAV4 posts a 0.19 rate, the Equinox a 0.36, and the CR-V a 0.53. All crossover SUVs, all with standard AEB on recent model years, all priced well above the $5,000-to-$10,000 range where teen car shopping actually happens.
So every quarterly decline NHTSA celebrates reflects newer, safer vehicles diluting the fleet average. And every teen death reflects the vehicles those statistics left behind.
The counterargument, at full strength
Post-pandemic licensing backlogs cleared during this period, flooding roads with newly permitted teens who had waited months or years for their behind-the-wheel appointments. More teens may have entered the driving pool between 2022 and 2024 than in typical years, and if teen VMT rose faster than teen fatalities, the per-mile risk may not have worsened as dramatically as the raw count suggests. MoneyGeek's analysis does not normalize teen deaths by teen-specific VMT because that data does not exist at seasonal resolution. Fair point, but even generous VMT assumptions cannot fully absorb a 17.2% fatality increase spread across two consecutive years. Something structural is happening.
What the numbers want you to know
If your teenager drives a pre-2015 sedan, pull the VIN at nhtsa.gov/recalls. Then check whether the vehicle has automatic emergency braking. If the answer is no, your kid is piloting a vehicle with a measurably higher fatality rate than the crossover SUVs passing them on the highway, and no amount of driver's ed compensates for 1,500 fewer pounds of crash structure and zero autonomous braking.
IIHS publishes a recommended vehicles list for teen drivers.[4] Every car on it has standard AEB and earned Top Safety Pick or better. The cheapest options start under $15,000 used, the same price range as a 2010 Civic, except with a fatality rate three to five times lower. The data is not subtle about what it recommends.
Summer is five weeks old, and the 100 Deadliest Days clock is running. For everyone over 20, the roads are measurably safer than they were two years ago. For the 16-year-old in a hand-me-down Altima with no AEB, no forward collision warning, and 3,100 pounds of curb weight against a fleet that averages 4,200, the roads got worse, and the national average that says otherwise is not their average.
Limitations
FARS codes drivers aged 15 to 20, which includes 19 and 20-year-olds who are legally adults. MoneyGeek uses June through August rather than the exact Memorial Day-to-Labor Day window. Our FARS vehicle-level data ends at 2023, while the teen fatality trend covers 2022 through 2024. Small-state teen counts are volatile: Arizona's doubling from 12 to 23 is directionally significant but involves counts where a handful of crashes shift the percentage. I cannot directly match teen-involved crashes to specific vehicle models because the MoneyGeek analysis does not cross-tabulate age with vehicle type. The vehicle-age inference is based on fleet composition data and the economic reality of teen car ownership, not direct measurement.
Sources & References
- MoneyGeek, “America’s 100 Deadliest Driving Days by State,” 2026. Analysis of FARS data 2022–2024 and FHWA VMT. moneygeek.com
- IIHS, “Recommended Vehicles for Teens” (criteria include standard AEB, crash test performance, and vehicle weight). iihs.org
- NHTSA, Fatality Analysis Reporting System (FARS), 2014–2023. Per-model death counts and estimated rates per 100M VMT. nhtsa.gov
- IIHS, “Vehicles for Teens” list, updated annually. iihs.org
- NHTSA, Preliminary 2025 Motor Vehicle Traffic Fatality Estimates, DOT HS 813 800, April 1, 2026. 36,640 deaths, 1.10 rate per 100M VMT. crashstats.nhtsa.dot.gov